
Author: aluna Analytics | Date: 30 April 2026 | Category: Market Intelligence
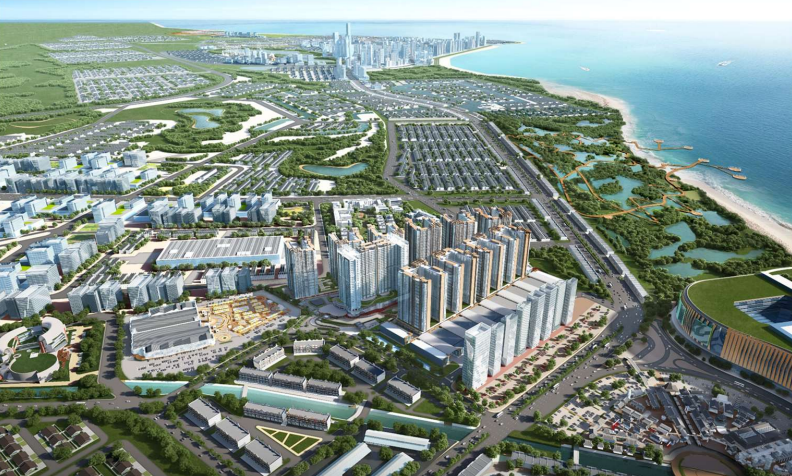
PT Bangun Kosambi Sukses Tbk ($CBDK) represents a highly specialized corporate entity operating at the nexus of commercial real estate development, infrastructure monetization, and master-planned urbanization. Established on 3 April 2000 and having commenced commercial operations in 2020, the company functions as a pivotal holding and operational vehicle within the expansive Pantai Indah Kapuk 2 mega-development, widely known as PIK 2. Located strategically in Tangerang, Banten, this coastal city project is fundamentally altering the economic geography of the Greater Jakarta region. The company is decisively controlled by its immediate parent, PT Pantai Indah Kapuk Dua Tbk ($PANI), which holds an 87.26 percent equity stake, while the ultimate controlling interests reside with two of Indonesia’s most formidable corporate conglomerates: the Agung Sedayu Group and the Salim Group.
The corporate trajectory of the enterprise was fundamentally accelerated on 13 January 2025, when the company officially listed on the Main Board of the Indonesia Stock Exchange. This Initial Public Offering was met with overwhelming institutional and retail demand, resulting in an oversubscription rate of 344.28 times. By offering 566,894,500 common shares—representing exactly ten percent of its issued and paid-up capital—at a price of Rp 4,060 per share, the company successfully raised approximately Rp 2.3 trillion. This pricing implied an initial market capitalization of over Rp 23 trillion, immediately establishing the firm as a heavyweight within the domestic property sector. The stated purpose of this capital injection was explicitly earmarked for the ambitious Nusantara International Convention Exhibition project, a colossal infrastructure endeavor designed to complement the central business district of PIK 2.
Line chart of Bangun Kosambi Sukses Tbk (CBDK) with timeframe 3 Months.
Unlike traditional residential property developers whose business models are heavily reliant on consumer mortgage availability and retail housing cycles, this enterprise operates with a distinctly bifurcated and highly lucrative commercial focus. Its expansive portfolio encompasses premium commercial properties, strategic land plots, and integrated business hubs. Notable developments under its umbrella include Permata Hijau Residences, Bizpark PIK 2, Soho Manhattan, The Bund, Millennial Shop Office, Manhattan Residences, Soho Wallstreet, Asia Afrika Shop Office, and the prominent Menara Syariah. The overarching objective is not merely to build and sell physical structures, but to curate a self-sustaining commercial ecosystem. By integrating corporate logistics, retail centers, and international convention facilities, the company seeks to permanently elevate the intrinsic value of its 699-hectare land bank, transitioning from episodic sales to a model supported by enduring commercial density.
Macroeconomic Environment and Sector Dynamics
Evaluating the financial condition and future earnings trajectory of the enterprise requires situating its operations within the broader macroeconomic and regulatory environment of the Republic of Indonesia as of the first quarter of 2026. The domestic economy is currently navigating a period of stable, albeit nuanced, expansion. Gross Domestic Product growth is projected to stabilize around 4.6 percent for 2026, supported by resilient domestic consumption, continuous infrastructure investments, and moderating inflationary pressures. This macroeconomic stability provides a reliable baseline for commercial real estate absorption, particularly in integrated urban corridors.
Monetary policy plays a critical role in shaping real estate dynamics. Bank Indonesia has maintained a cautious but supportive stance, holding the benchmark interest rate at 4.75 percent through the early months of 2026, following periods of slight easing from previous highs. While lower interest rates traditionally stimulate the retail property market by reducing mortgage carrying costs, the specific business model of this enterprise is structurally insulated from retail mortgage cyclicality. Because the firm predominantly engages in business-to-business transactions—selling massive commercial land plots and premium retail spaces to corporate entities and institutional investors—its revenue velocity is driven by corporate capital expenditure budgets, foreign direct investment flows, and supply chain logistics, rather than the consumer credit cycle. Bank Indonesia data indicates that outstanding property loans reached Rp 1,483 trillion by late 2025, growing at a robust 7.48 percent year-over-year, signaling that domestic financial institutions maintain a strong risk appetite for property-related lending, which indirectly supports the corporate clientele.
Furthermore, the domestic real estate sector continues to benefit from targeted fiscal stimuli. The Indonesian government has proactively extended Value Added Tax incentives for residential properties priced below Rp 5 billion through the first half of 2026. Additionally, the abolishment of certain asset-transfer duties and the simplification of building construction approvals have alleviated both demand-side affordability constraints and supply-side regulatory bottlenecks. While operations are weighted toward commercial development, subsidiary operations in residential segments, such as the Permata Hijau Residences, undoubtedly capture the tailwinds of these government incentives, ensuring that the residential portfolio remains a net contributor to working capital rather than a stagnant drain.
The most profound macroeconomic catalyst, however, is infrastructural rather than monetary. The value proposition of the PIK 2 central business district is intrinsically tethered to its spatial connectivity. The progressive opening and integration of the KATARAJA toll road network has fundamentally altered the accessibility of the region. By providing direct, high-speed connectivity to both the Soekarno-Hatta International Airport and the urban core of central Jakarta, this infrastructure transforms PIK 2 from a peripheral satellite city into a primary logistical and commercial hub. The industrial and logistics landscape in Greater Jakarta has evolved rapidly, fueled by the expansion of third-party logistics providers and international e-commerce platforms. The strategic location perfectly intercepts this demand, serving as a premium staging ground for global and domestic corporations requiring immediate proximity to Indonesia’s primary aviation gateway.
Income Statement Performance and Earnings Quality
An examination of the interim consolidated statements of profit or loss for the three-month period ended 31 March 2026 reveals an enterprise operating with extraordinary operational momentum, characterized by massive revenue expansion and exceptional profit margins. However, beneath the impressive headline figures lies a highly concentrated revenue base and a unique regulatory tax advantage that demands careful analytical deconstruction to assess the true durability of these earnings.
Revenue Expansion and Customer Concentration
For the first quarter of 2026, the company reported consolidated net revenues of Rp 742.59 billion. This represents a staggering 74.1 percent year-over-year increase compared to the Rp 426.34 billion generated in the corresponding three-month period of 2025. This top-line expansion indicates that the monetization strategy for the PIK 2 commercial land bank is accelerating precisely as the surrounding infrastructure matures.
The composition of this revenue highlights specific market positioning. The overarching corporate entity operates through multiple subsidiaries and is segmented into distinct business lines, primarily Real Estate and the newly operational Convention and Exhibition segment. The Real Estate segment is the overwhelming economic engine, generating Rp 736.77 billion, or 99.2 percent of total consolidated revenues. Within this segment, the outright sale of land and buildings accounted for Rp 724.36 billion, while recurring rental income contributed a modest Rp 3.23 billion.
| Major Customer Concentration (Q1 2026) | Revenue (in thousands of Rupiah) | Percentage of Total Revenue |
|---|---|---|
| PT Global Jet Express | 268,827,273 | 36.20% |
| PT Erajaya Swasembada Tbk | 248,882,883 | 33.51% |
| All Other Customers | 224,881,355 | 30.29% |
| Total Consolidated Net Revenues | 742,591,511 | 100.00% |
Together, these two corporate entities accounted for nearly 70 percent of the revenue in a single quarter. This validates the thesis that PIK 2 is successfully being marketed as an elite corporate and logistical hub. Erajaya and Global Jet Express require expansive, highly connected land plots near the airport for warehousing, fulfillment centers, and corporate headquarters. However, this high degree of concentration implies that short-term revenue velocity is highly susceptible to the specific capital expenditure cycles of a few domestic giants. If macroeconomic conditions prompt these conglomerates to pause their expansion, the top-line growth could experience severe volatility.
Gross Margin Dynamics and Structural Cost Advantages
The profitability metrics of the enterprise are remarkably high. For the three months ended 31 March 2026, the company reported a consolidated gross profit of Rp 615.88 billion, translating to a consolidated gross margin of 82.9 percent. This marks a significant expansion from the 55.8 percent gross margin recorded in the first quarter of 2025 (gross profit of Rp 238.22 billion on revenues of Rp 426.34 billion).
When analyzing the segments in isolation, the underlying economics become even more profound. The core Real Estate segment recorded revenues of Rp 736.77 billion against a cost of revenues of merely Rp 86.77 billion. This results in an astonishing segmental gross margin of 88.2 percent. Margins of this magnitude are exceptionally rare in global real estate and point to a deep structural advantage regarding land acquisition costs. Because the PIK 2 area is a master-planned reclamation and development project executed over many years by the parent conglomerates, the historical cost basis of the undeveloped land that was transferred into inventory is remarkably low. As basic infrastructure is installed and the overarching ecosystem matures, these commercial plots are monetized at premium contemporary valuations. This 88 percent margin is not a cyclical anomaly driven by temporary pricing power; rather, it is the mechanical realization of long-term value capture inherent to a monopolistic master-developer business model.
In contrast to the highly profitable real estate operations, the Convention and Exhibition segment reported revenues of Rp 5.81 billion against a cost of revenues of Rp 39.92 billion, resulting in a segmental gross loss of Rp 34.11 billion. While this may appear as a severe operational deficiency, it is largely an accounting artifact driven by the capital-intensive nature of the project.
The Final Tax Regime and Net Profit Conversion
Below the gross profit line, disciplined control over operating expenses is maintained. Selling expenses slightly decreased year-over-year to Rp 13.03 billion, while general and administrative expenses experienced a minor increase to Rp 49.21 billion. The largest component of general and administrative expenses is employee costs (Rp 22.54 billion), followed by management fees paid to the parent company (Rp 6.26 billion).
The most critical factor elevating the quality and magnitude of the earnings is the Indonesian regulatory framework regarding real estate taxation. Under domestic tax law, revenues derived from the sale of real estate and the leasing of land and buildings are subject to a final income tax regime. This system levies a flat percentage on the gross transaction value, entirely bypassing standard corporate income calculations based on pre-tax profitability.
For the first quarter of 2026, a final tax expense of Rp 21.72 billion was recorded. When measured against the total consolidated revenue of Rp 742.59 billion, this translates to an effective tax rate of approximately 2.92 percent on the top line. The strategic advantage of this tax structure cannot be overstated for a company operating with 88 percent gross margins. In a standard corporate tax environment, assuming a statutory rate of 22 percent, the massive pre-tax profits generated by the low historical cost of land would be heavily penalized, resulting in massive cash outflows to the state. However, the final tax regime acts as an impermeable shield, allowing the immense gross margins to flow directly through the income statement to the bottom line with minimal attrition.
Consequently, a net profit for the period of Rp 546.23 billion was reported. This equates to a phenomenal net profit margin of 73.5 percent. Earnings of this quality and magnitude are highly durable specifically because they are structurally protected by a fixed regulatory tax framework that applies uniformly across the sector, allowing the retention of the vast majority of the value created by the low land-cost basis.
The Economics of the NICE Project
A central pillar of the strategic narrative, and the explicit justification for the multi-trillion Rupiah initial public offering, is the development and operation of the Nusantara International Convention Exhibition. Understanding the financial and strategic mechanics of this facility is essential to grasping the long-term value proposition.
Scale, Capacity, and Sector Disruption
The facility, commonly referred to as NICE, is an infrastructure project of unprecedented scale within the Indonesian market. Located on a massive 40-hectare site within the PIK 2 perimeter, the venue boasts a gross built-up area of 300,000 square meters and a net leasable area of 130,000 square meters. Designed to accommodate up to 200,000 attendees simultaneously, the complex features expansive central atriums designed for optimal crowd flow, 6,340 dedicated parking spaces, and cutting-edge technological integrations including fiber-optic cabling and bonded warehousing for rapid international customs clearance. The total capital expenditure required to bring this facility to life is estimated at approximately Rp 4 trillion, excluding the underlying land costs.
Prior to the completion of this venue, the Greater Jakarta area relied on legacy facilities such as the Jakarta Convention Center, JI-Expo Kemayoran, and ICE BSD, which collectively offered less than 200,000 square meters of leasable space. By adding 130,000 square meters to the national inventory, NICE does not merely compete for existing market share; it structurally expands Indonesia’s capacity to host simultaneous, mega-scale global events, directly competing with regional hubs like Singapore and Bangkok for the lucrative Meetings, Incentives, Conferences, and Exhibitions sector.
The venue underwent a soft launch period beginning in August and September of 2025, allowing management to fine-tune operational logistics before entering full commercial utilization. As of early 2026, the facility has successfully secured and hosted a robust pipeline of marquee events. Notably, the venue hosted the Pet Adventure Wonderland (PAW) Expo from 9 to 12 April 2026, which drew an independently verified attendance of 51,308 visitors over four days, proving the venue’s ability to handle massive retail crowds. Looking forward through the remainder of 2026, the calendar includes the prestigious Jakarta International Java Jazz Festival in late May, the Hammersonic rock festival, the Keramika Indonesia ASEAN ceramics expo in June, and the Automechanika Jakarta exhibition in September, which has already pre-booked sixty percent of its floor space.
The Financial Drag and the Loss-Leader Thesis
Despite this impressive operational momentum and strong event booking pipeline, the Convention and Exhibition segment reported a gross loss of Rp 34.11 billion in the first quarter of 2026, driven by Rp 39.92 billion in cost of revenues. To properly assess business quality, it is vital to distinguish between actual cash burn and accounting artifacts.
The consolidated financial statements indicate that Rp 32.38 billion in depreciation expense allocated specifically to the cost of revenues was recognized during the quarter. This figure represents the straight-line depreciation of the massive Rp 2.58 trillion carrying value of the NICE building structure over a twenty-year useful life. When this non-cash depreciation charge is added back to the segmental gross loss, the Convention and Exhibition segment is operating at a near break-even cash basis (a marginal negative cash flow of roughly Rp 1.72 billion). This reveals that while the sheer scale of the building creates a heavy, recurring drag on GAAP earnings, the actual day-to-day operations of the venue are not a severe drain on corporate liquidity.
The symbiotic relationship is clear: the immense capital expenditures and depreciation drag of the convention center are absorbed to synthesize demand and extract 88 percent gross margins on the sale of the adjacent real estate.
More importantly, analyzing the convention center strictly as a standalone profit center fundamentally misinterprets the strategic architecture. A convention facility of this magnitude is rarely built solely for direct rental yields; it is engineered as a macroeconomic loss-leader and a colossal generator of human foot traffic. By drawing hundreds of thousands of affluent international travelers, corporate executives, exhibitors, and domestic consumers into the PIK 2 ecosystem, the venue creates an intense, localized gravitational pull.
This massive influx of physical traffic directly catalyzes the monetization of the primary asset: the surrounding commercial land bank. International corporations, logistics providers, and hospitality chains require real estate in immediate proximity to premier global convention centers. The existence of NICE fundamentally alters the pricing power wielded over commercial plots. In 2024, an extraordinary Rp 2.1 trillion in marketing sales was achieved, with a full Rp 1.5 trillion derived explicitly from the pre-sale of commercial land plots. Moving into 2026, management has set an aggressive marketing sales target of Rp 563 billion specifically aimed at optimizing the monetization of commercial land within the central business district, capitalizing on the early recovery of business appetite for strategic locations.
The accounting losses of the venue are vastly overshadowed by the supernormal profits realized on the land sales it facilitates.
Cash Flow Mechanics and Revenue Recognition
While the income statement reflects flawless execution and extreme profitability, an analysis of the cash flow statement introduces critical nuances regarding working capital absorption, the timing of revenue recognition, and the strategic deployment of capital. A superficial reading of the cash flows might raise alarms, but a deep understanding of Indonesian accounting standards reveals a highly secure financial position.
Unwinding the Cash Flow Disconnect
For the three months ended 31 March 2026, a stellar net income of Rp 546.23 billion was reported. Paradoxically, over the same period, negative net cash flows used in operating activities amounting to Rp 130.87 billion were recorded. This represents a sharp reversal from the first quarter of 2025, during which a positive operating cash flow of Rp 349.57 billion was generated. In many industries, negative operating cash flow coupled with record net income is a classic indicator of aggressive accounting, channel stuffing, or deteriorating receivables quality. However, in this specific context, the divergence is entirely benign and mechanically driven by the strict application of the Statement of Financial Accounting Standards 115 regarding revenue from contracts with customers.
Under the prevailing accounting standards, real estate developers cannot recognize revenue at the moment a sales contract is signed or when cash installments are received from the buyer. Instead, revenue is recognized only when the core performance obligation is satisfied—which, in this jurisdiction, is typically defined as the physical and legal handover of the completed land or building unit to the customer.
| Statement of Cash Flows (Extract, in thousands of Rupiah) | Q1 2026 | Q1 2025 |
|---|---|---|
| Receipt from customers | 278,825,921 | 815,432,012 |
| Cash paid to suppliers and other operating expenses | (390,121,871) | (438,711,451) |
| Cash paid to employees | (21,079,731) | (20,132,465) |
| Receipt of interest | 16,054,909 | 14,065,238 |
| Payment of corporate and final income tax | (14,555,023) | (21,081,214) |
| Net Cash Flows (Used In)/Generated From Operating Activities | (130,875,795) | 349,572,120 |
During the first quarter of 2026, an impressive Rp 742.59 billion in top-line revenue was recognized through the income statement. Yet, the cash flow statement explicitly details that actual cash receipts from customers during the quarter totaled only Rp 278.82 billion. This mathematical discrepancy confirms that approximately Rp 463.77 billion of the revenue recognized in the first quarter was drawn down from historical cash deposits that had been collected in previous years and parked on the balance sheet as unearned customer advances.
Simultaneously, a high velocity of cash outflows to suppliers, contractors, and employees was maintained, totaling Rp 411.20 billion. These outflows were required to fund the ongoing construction of residential units, the finalizations of commercial infrastructure, and operational overhead. Therefore, the negative operating cash flow of Rp 130.87 billion is not a symptom of a deteriorating business model, poor cash conversion, or uncollectible receivables. Rather, it represents the natural, mechanical unwinding of a highly successful pre-sales business model. The actual cash was secured and banked in prior periods, creating a massive liability, and the GAAP earnings are only now catching up to economic reality as the properties are finally completed and legally transferred.
Investing and Financing Decisions
Beyond the core operations, investing and financing cash flows illuminate strategic priorities and capital allocation frameworks. Investing activities consumed a net Rp 154.81 billion during the quarter. This outflow was driven predominantly by the acquisition of fixed assets amounting to Rp 63.76 billion and capital expenditures for investment properties totaling Rp 62.29 billion. These figures reflect the tail-end capitalization requirements of the NICE project and the continued build-out of supporting infrastructure within the PIK 2 central business district.
Financing activities resulted in a net cash outflow of Rp 89.89 billion. While scheduled repayments of bank loans totaling Rp 15.64 billion and interest expenses of Rp 4.32 billion were made, the most significant transaction within the financing section was a voluntary equity contraction. A massive Rp 61.28 billion cash outflow dedicated entirely to the repurchase of treasury shares was recorded.
Disclosures reveal that between 3 February 2026 and 2 May 2026, specific regulatory provisions enacted by the Financial Services Authority that permit listed companies to execute share buybacks without convening a General Meeting of Shareholders during periods of significant market fluctuation were utilized. During the reporting period, 11,257,600 of its own shares were acquired on the open market. Dividing the total cash outlay by the number of shares acquired yields an average repurchase price of approximately Rp 5,443 per share.
This capital allocation decision is highly signaling. Given that the IPO was executed just one year prior at an offering price of Rp 4,060 per share, the willingness to deploy over Rp 61 billion in corporate cash to repurchase equity at a 34 percent premium to the IPO price indicates profound internal conviction. It signals to the market a belief that the current public valuation fundamentally underestimates the intrinsic value of the underlying land bank and the future cash flow generation capacity of the PIK 2 ecosystem.
Balance Sheet Integrity and the Concept of Hidden Equity
The balance sheet of the enterprise is highly idiosyncratic. It is defined by a massive, historically priced land bank, an absolute minimum of traditional financial leverage, and an enormous liability base consisting almost entirely of unearned customer revenue. This unique structure creates a scenario where the stated book value of equity significantly underrepresents the true economic value of the corporation.
Asset Composition and the Inventory Moat
As of 31 March 2026, total consolidated assets of Rp 22.43 trillion were reported, reflecting a marginal contraction from the Rp 22.57 trillion reported at the end of 2025 due to the aforementioned cash outflows. The asset base is overwhelmingly tangible and highly liquid. Cash and cash equivalents stand at a robust Rp 2.74 trillion, consisting primarily of bank balances and short-term time deposits spread across various financial institutions. This immense cash buffer provides unparalleled liquidity, allowing navigation of macroeconomic shocks, construction delays, or supply chain disruptions without the need to access expensive bridge financing.
The true core of the enterprise value, however, resides within inventory classifications. Rp 6.98 trillion in undeveloped land is held, representing a massive 3.32 million square meters of raw potential, classified as a non-current asset. Concurrently, Rp 6.98 trillion in current inventories is held. This current portion is stratified into land under development (Rp 5.49 trillion), buildings under active construction (Rp 342.42 billion), and land and buildings that are completed and ready for sale (Rp 1.15 trillion).
The presence of nearly Rp 14 trillion in combined inventory acts as a formidable inflation hedge and a guaranteed pipeline of future revenue. Under Indonesian accounting standards, this inventory is carried on the balance sheet at the lower of historical cost or net realizable value. Because the land was acquired and reclaimed years prior to the current infrastructure boom, its carrying value on the balance sheet is exceptionally low. Given the repeatedly demonstrated ability to sell this land at an 88 percent gross margin upon realization, the true fair market value of this 14 trillion Rupiah land bank is likely multiples higher than its stated book value. The balance sheet, therefore, contains a massive, unrecorded reservoir of intrinsic value.
Liability Structure and Financial Risk
Total liabilities stood at Rp 9.96 trillion at the end of the first quarter of 2026. A traditional quantitative screener might view a liability-to-equity ratio of approximately 0.8x as representing a moderate degree of financial leverage. However, a forensic review of the liability composition reveals that the operations carry effectively zero traditional financial risk.
Traditional interest-bearing bank loans amount to a mere Rp 233.83 billion, comprising Rp 50.39 billion in short-term obligations and Rp 183.44 billion in long-term debt. These loans, primarily structured as sale and purchase of bills (Cessie) facilities with banks such as PT Bank Artha Graha Internasional Tbk, PT Bank Negara Indonesia (Persero) Tbk, and PT Bank Nationalnobu Tbk, carry interest rates ranging from 6.50 to 9.00 percent and are utilized merely for transitional working capital. When this trivial debt burden is offset against the Rp 2.74 trillion in pure cash, a negative net debt position of approximately Rp 2.51 trillion is achieved. The enterprise is entirely self-funded through its own operations and the aggressive pre-sales model, completely insulating it from the risks of refinancing or sudden spikes in central bank interest rates.
The Mechanics of Hidden Equity
If financial debt is negligible, the vast majority of the liabilities must originate elsewhere. The balance sheet details “Advances from customers” totaling an astounding Rp 9.54 trillion, divided into a short-term portion of Rp 7.95 trillion and a long-term portion of Rp 1.12 trillion. These advances represent hard cash that has already been received from buyers for commercial plots and residential units that have not yet been completed or legally handed over.
Crucially, these advances are performance liabilities, not financial liabilities requiring cash repayment. To legally extinguish this Rp 9.54 trillion liability, money does not need to be wired back to the customers; rather, roads need to be paved, structures completed, and keys handed over. Because the underlying land is already owned free-and-clear, and the bulk of the development costs have already been incurred and capitalized within the existing Rp 13.9 trillion inventory balance, the marginal cash cost required to deliver on these advances is incredibly low.
Assuming the historical gross margin of 88 percent holds consistent, delivering the real estate necessary to extinguish this Rp 9.54 trillion in deferred revenue will require only roughly Rp 1.14 trillion in inventory depletion. The remaining Rp 8.4 trillion will flow directly through the income statement as recognized gross profit. Because this profit will only be subject to minimal operating overhead and the hyper-efficient 2.9 percent final tax regime, the vast majority of that Rp 8.4 trillion will drop directly into retained earnings.
Therefore, there is roughly Rp 8 trillion in pure, guaranteed “hidden equity” currently masquerading as a liability on the balance sheet. As the construction cycle concludes and physical handovers accelerate in the coming quarters, the stated equity of Rp 12.46 trillion will rapidly and mechanically converge upward. Failing to adjust the stated book value for this deferred profitability will fundamentally misprice the asset.
Strategic Capital Allocation and Sovereign Investments
A unique, highly conspicuous, and revealing component of the non-current assets is a Rp 850 billion classification categorized under “Other investments”. Disclosures explicitly indicate that on 21 October 2025, this capital was allocated to purchase Long Term Bonds Series A and Series B issued by PT Danantara Investment Management (Persero), commonly referred to in the market as the “Patriot Bonds”. These debt instruments carry a nominal coupon rate of just 2.0 percent per annum and are scheduled to reach maturity in October 2030 and October 2032, respectively.
From a purely quantitative, financial perspective, allocating nearly a trillion Rupiah to a highly illiquid, Level 3 asset yielding a mere 2.0 percent represents a destruction of economic value. The opportunity cost of this capital is substantial; the Indonesian Central Bank benchmark rate hovers around 4.75 percent, and even standard, risk-free bank time deposits yield between 2.00 and 6.75 percent. The rationale for this investment extends beyond a traditional discounted cash flow model.
To understand this allocation, one must view it through the lens of political economy. Danantara is the newly established sovereign wealth fund of Indonesia, created to manage state-owned enterprise assets and execute strategic national development agendas. The Patriot Bonds were issued as a voluntary private placement targeting the nation’s wealthiest conglomerates. The proceeds, which totaled roughly Rp 50 trillion across the initial issuances, are earmarked for critical national infrastructure, specifically large-scale waste-to-energy projects designed to help the country achieve its net-zero emissions targets by 2060.
By subscribing to these bonds, the Agung Sedayu and Salim groups—acting through their control of $CBDK—are effectively demonstrating their alignment with the state’s sovereign agenda. The real estate development sector in emerging markets is uniquely exposed to regulatory risk; it depends entirely on favorable zoning laws, seamless building permits, continuous government infrastructure support (such as toll road integrations), and broad regulatory goodwill.
In this context, the Rp 850 billion allocation functions economically as an intangible asset. It is a strategic toll paid to ensure the long-term regulatory stability and governmental support required to execute the multi-decade PIK 2 master plan. While the 2 percent yield creates a mathematical drag on the return on invested capital, the preservation of the master-developer monopoly and the mitigation of regulatory interference more than justify the financial opportunity cost.
Operational Risks and Ecosystem Dependencies
Despite the fortress balance sheet, zero net debt, and extraordinary profit margins, institutional analysis must rigorously highlight the structural risks and operational fragilities embedded within the business model. The primary vulnerabilities arise from its concentrated customer base, subservience to the parent conglomerate ecosystem, and the execution risks associated with the MICE industry.
1. Extreme Revenue Concentration Risk
The most glaring operational vulnerability is the extreme reliance on a highly concentrated corporate customer base. Transactions with just two entities—PT Global Jet Express and PT Erajaya Swasembada Tbk—accounted for nearly 70 percent of total recognized revenue in the first quarter of 2026. While this validates the B2B commercial strategy, it renders the cash flow profile dangerously lumpy. Dependence on the continued capital expenditure expansion plans of a few major domestic conglomerates means that if macroeconomic shocks, supply chain disruptions, or changes in e-commerce dynamics force major Indonesian retailers or logistics providers to halt their physical footprint expansion, the ability to monetize commercial plots at current volumes could severely and abruptly contract.
2. Ecosystem Dependency and Related-Party Governance
Operations are not entirely independent; they are inextricably tethered to the broader PIK 2 master plan dictated by the parent, PT Pantai Indah Kapuk Dua Tbk ($PANI), and the ultimate controlling shareholders. This intense interconnectedness manifests in significant related-party transactions that introduce standard corporate governance concerns regarding the equitable treatment of minority public shareholders. A Management Fee Cooperation Agreement with the parent, valid through the end of 2026, dictates that the parent provides strategic planning, financial, marketing, and human resources services in exchange for actual costs plus a 10 percent margin. In the first quarter of 2026 alone, Rp 6.26 billion in management fees was paid. Furthermore, a significant portion of liquidity and financing operates within affiliated networks, holding massive cash balances and time deposits at related-party banks, raising the risk of transfer pricing inefficiencies.
3. Execution Risk of the MICE Operations
While the theoretical model of the Nusantara International Convention Exhibition acting as a loss-leader to catalyze land sales is strategically sound, the operational reality of managing a 130,000 square meter facility introduces entirely new core competencies. Operating an international convention center involves navigating complex logistics, managing massive utility and maintenance overheads, and gaining exposure to the highly cyclical hospitality and live-events industry. The success of the NICE project requires a continuous, year-round pipeline of massive international events. If the venue fails to secure this pipeline, the operational cash bleed required to maintain the massive structure could widen beyond acceptable parameters, transforming a catalytic asset into a permanent financial liability.
Valuation Paradigm and Peer Comparison
Evaluating the enterprise requires a departure from traditional, simplistic valuation frameworks. Because the balance sheet and income statement are heavily distorted by the mechanics of real estate accounting under PSAK 115 and the specific lifecycle of the PIK 2 development, standard multiples can be highly misleading.
According to market data, the stock trades at a normalized Price-to-Earnings (P/E) ratio of approximately 20.63x and a Price-to-Book (P/B) ratio of 3.13x, while generating a Return on Equity (ROE) of 19.08 percent and a Return on Assets (ROA) of 6.83 percent. In isolation, a 20.6x P/E multiple suggests a premium valuation, especially when compared to traditional domestic property peers. Analyst consensus estimates for standard Indonesian developers indicate forward P/E ratios ranging from a low of 4.8x to a high of 8.7x, with P/B ratios hovering below 1.0x.




However, applying the valuation multiples of traditional homebuilders represents a fundamental category error. Companies like PT Ciputra Development Tbk ($CTRA) and PT Summarecon Agung Tbk ($SMRA) operate primarily in the business-to-consumer residential market, relying on the slow, cyclical absorption of mid-tier housing supported by consumer mortgages and government VAT incentives. Their business models are highly sensitive to interest rates, purchasing power constraints, and localized affordability limits, justifying their lower, single-digit earnings multiples. By contrast, a business-to-business model focused on commercial urbanization and infrastructure monopoly commands a different paradigm.
| Peer Valuation Comparison (Estimated 2025/2026 Forward) | Forward P/E (x) | Forward P/B (x) |
|---|---|---|
| PT Bangun Kosambi Sukses Tbk (CBDK) | 20.63 (Normalized) | 3.13 |
| PT Ciputra Development Tbk (CTRA) | 7.30 | 0.70 |
| PT Summarecon Agung Tbk (SMRA) | 8.70 | 0.60 |
| PT Bumi Serpong Damai Tbk (BSDE) | 4.80 | 0.40 |
| PT Pakuwon Jati Tbk (PWON) | 7.80 | 0.80 |
Furthermore, the 20.6x trailing P/E ratio is heavily inflated by the deferred revenue mechanics. The Rp 9.54 trillion in customer advances on the balance sheet represents billions of Rupiah in fully secured, high-margin future profit that is not yet reflected in the trailing earnings figure. As these handovers are executed in the coming quarters, the denominator in the P/E ratio will mechanically expand, rapidly compressing the valuation multiple to a much more attractive level. Similarly, the 3.13x P/B ratio fails to account for the immense “hidden equity” contained within the deferred revenue liability and the massive undervaluation of the 13.9 trillion Rupiah historical-cost land bank. When the balance sheet is adjusted to reflect the fair market value of the land and the guaranteed forward profitability of the unearned revenue, the adjusted Price-to-Book multiple drops precipitously, aligning much more closely with fair value.
Concluding Investment Perspective
PT Bangun Kosambi Sukses Tbk exhibits the defining characteristics of a high-quality, monopolistic compounder, fundamentally distinct from traditional cyclical property developers. By controlling the central commercial zone of the PIK 2 mega-development, immense barriers to entry, captive corporate demand, and structural cost advantages consistently yield gross margins approaching 90 percent.
The financial profile is virtually impregnable to traditional credit shocks. Operating with negative net debt and billions of Rupiah in excess cash liquidity, exposure to central bank interest rate volatility is entirely insulated. The perceived weakness in operating cash flow is a benign accounting mechanism reflecting the unwinding of an incredibly successful pre-sales campaign, while the massive liability base of customer advances serves as a secure, guaranteed reservoir of future profitability. The highly favorable final tax regime ensures that these gross profits convert to net income at an elite, structural rate.
While the allocation of capital to the low-yielding Patriot Bonds and the immense depreciation drag of the NICE convention center suppress immediate accounting returns, these are necessary deployments of capital. They function to secure the political stability and intense human foot traffic required to continuously monetize the core land bank at premium valuations. The aggressive execution of treasury share buybacks at a substantial premium to the IPO price confirms profound conviction in this long-term strategy.
Given a fortress balance sheet, a massive pipeline of secured forward revenue, and the irreversible momentum of infrastructural integration, the enterprise warrants a definitive premium valuation in the public equity markets. It represents a high-conviction opportunity for institutional portfolios seeking insulated, high-margin exposure to the commercial expansion of the Greater Jakarta economic corridor.
Disclaimer
aluna Analytics is an independent research collective that operates without affiliation to any financial institution, broker, or advisory firm. We do not hold licenses as a securities dealer, investment advisor, or portfolio manager.
All materials published by aluna Analytics are created solely for informational and educational purposes. They reflect independent analytical interpretation and should not be regarded as personalized investment advice, solicitation, or endorsement of any security or strategy.
Market data, opinions, and projections presented herein are subject to change and may not predict future results. Readers remain fully responsible for any financial decisions made based on the information provided. We strongly encourage conducting personal due diligence and consulting a licensed professional before making investment commitments.
aluna Analytics is not regulated by the Financial Services Authority of Indonesia (OJK) and does not offer investment management or brokerage services. All content is presented in good faith, aiming to foster research literacy and informed market perspectives.