

Author: aluna Analytics | Date: 3 May 2026 | Category: Market Intelligence
PT Sariguna Primatirta Tbk ($CLEO) operates as one of the most prominent pure-play bottled drinking water manufacturers within the Republic of Indonesia. Established initially in 1988 and commencing its commercial operations in 2003, the enterprise functions as a critical, cash-generating subsidiary within the broader Tancorp Group conglomerate, which is ultimately controlled by PT Tancorp Global Sentosa and spearheaded by the controlling party, Hermanto Tanoko. The fundamental business model of the company revolves around the purification, packaging, marketing, and distribution of drinking water. This product category is characterized by commoditized underlying contents but highly differentiated brand equity, packaging innovation, and, most crucially, supply chain execution. The company categorizes its revenue streams primarily into Bottle and Non-bottle segments, allowing it to capture both the premium on-the-go consumption market with brands like SuperO2 and Vio8+, and the volume-driven household and institutional gallon market under the core Cleo brand.
Corporate Governance and Shareholder Architecture
Evaluating the corporate governance and shareholder architecture provides vital context for the company’s capitalization strategy. As of the end of 2025, the ownership structure is heavily concentrated, reflecting the firm’s conglomerate roots. PT Tancorp Global Abadi holds the majority controlling stake at 56.12%, while PT Tancorp Global Sentosa retains 21.09%. The public float constitutes approximately 22.79% of the outstanding shares. This tightly held equity structure ensures that strategic decision-making remains insulated from short-term market pressures, allowing management—led by President Director Melisa Patricia and Director Lukas Setio Wongso Wong—to execute multi-year, capital-intensive expansion plans.
The financial reporting integrity of the enterprise is validated by independent auditors Crowe (Teramihardja, Pradhono & Chandra), who issued an unqualified opinion on the consolidated financial statements for the year ended December 31, 2025. The auditors specifically highlighted the existence and valuation of inventories as the primary Key Audit Matter. With net inventories amounting to Rp 305.35 billion, representing 10.12% of total consolidated assets scattered across dozens of regional branches, the auditors performed extensive roll-forward and roll-back procedures to verify existence, ensuring that the allowance for decline in market value and obsolescence was adequate. This rigorous external validation confirms that the balance sheet is devoid of material misstatements regarding its working capital, establishing a reliable foundation for deeper financial analysis.
The Economics of Localized Manufacturing and Capacity Expansion
To understand the financial mechanics of PT Sariguna Primatirta Tbk, one must first understand the fundamental economics of the bottled water industry. Water is exceptionally heavy and carries a very low retail value per unit of weight. Consequently, transportation and logistical costs inherently erode gross margins if production facilities are located too far from the end consumer. An operator cannot profitably manufacture water in Java and ship it across the ocean to Kalimantan or Sulawesi; the freight costs would entirely consume the operating margin.
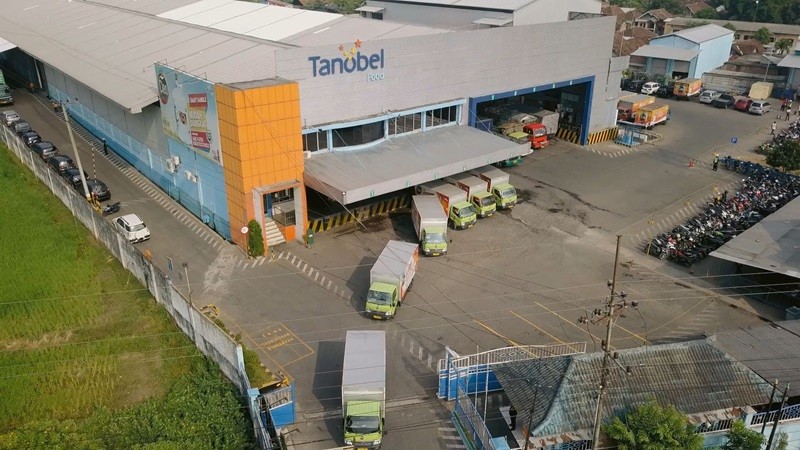
To overcome this structural geographical constraint, the company has deployed a highly capital-intensive, decentralized manufacturing strategy. By the end of 2025, the firm operated 32 active manufacturing plants scattered across the Indonesian archipelago, representing the largest network of any bottled water producer in the nation. This localized footprint is supported by a massive distribution ecosystem comprising over 10,000 distribution partners. In early 2026, the company executed further strategic plans to bring three additional facilities online in Palu (Central Sulawesi), Pontianak (West Kalimantan), and Pekanbaru (Riau), targeting a total of 35 operational plants.
This aggressive geographical footprint expansion serves multiple operational purposes. First, it minimizes logistical friction and reduces distribution lead times, ensuring product freshness and availability. Second, it acts as a structural hedge against domestic fuel price volatility and inter-island shipping rates. Finally, it embeds competitive advantages that smaller regional players or centralized national players cannot easily replicate. While the bottled water industry in Indonesia is fiercely competitive—populated by over 1,300 factories and 2,000 brands, including formidable rivals like Danone’s Aqua and Mayora’s ($MYOR) Le Minerale—the primary barrier to scale is not brand creation, but distribution density. The company’s relentless capital expenditure to build regional plants effectively widens its economic moat, trading variable transportation costs for fixed depreciation costs.
Domestic Macroeconomic Environment and Consumer Spending Trends
The operational performance of the company in the first quarter of 2026 must be evaluated against the backdrop of the Indonesian macroeconomic environment. The domestic landscape in early 2026 provided a highly supportive arena for fast-moving consumer goods operators. According to the Central Statistics Agency, inflationary pressures within Indonesia cooled significantly, with the headline Consumer Price Index dropping to 3.48% year-over-year in March 2026, down from 4.76% in February. Core inflation, which strips out volatile food and administered prices, stabilized at an entirely manageable 2.52%.
This moderation in domestic inflation was curated by the coordinated policies of Bank Indonesia and regional inflation control teams, bolstered by the National Food Resilience Program. The stabilization of staple food prices preserved household purchasing power just as the nation entered a period of peak consumption. The confluence of the Chinese New Year in February, followed immediately by the Ramadan fasting month and the Eid al-Fitr festivities spanning March and April, generated a massive spike in discretionary and non-discretionary consumer demand.
Furthermore, fiscal support served as a near-term buffer for the lower-income demographic, with government stimulus packages and cash transfers deployed in late 2025 carrying positive momentum into the first quarter of 2026. The S&P Global purchasing managers’ index for Indonesian manufacturing also reflected this optimism, recovering to 52.6 in January 2026, indicating expanding output ahead of the holiday season. For a consumer-facing beverage company, this alignment of cooling inflation, fiscal stimulus, and peak seasonal festivities created an optimal environment for aggressive volume expansion, directly catalyzing the double-digit top-line growth the company experienced in 1Q26.
Global Supply Chain Fragility and Petrochemical Volatility
Conversely, while the domestic consumer environment was highly favorable, the global macroeconomic landscape presents a severe and escalating threat to the company’s margin durability. The primary raw material for the company’s packaging is Polyethylene Terephthalate (PET) resin. The supply chain for PET is deeply entrenched in the global petrochemical complex; it is synthesized from purified terephthalic acid and monoethylene glycol, both of which are downstream derivatives of naphtha, a product of crude oil refining.
Following the escalation of geopolitical conflict in the Middle East—specifically the tensions involving Iran and resulting in critical disruptions around the Strait of Hormuz—global crude oil and naphtha prices have experienced violent upward volatility. The Strait of Hormuz is one of the world’s most critical energy chokepoints, and disruptions to maritime traffic have choked supplies of naphtha to Asian chemical producers. By April 2026, regional PET resin prices in Southeast Asia surged, climbing 2.5% sequentially to approximately $1,210 to $1,250 per metric ton.
The inability to seamlessly hedge these commodity exposures leaves the income statement highly vulnerable to the whims of Middle Eastern geopolitics and ocean freight volatility.
More alarmingly for the company, the localized disruption in Indonesia has led to acute shortages and price gouging in downstream plastic packaging. Market intelligence from Indonesian trade hubs indicates that the price of virgin plastic packaging materials has doubled in some categories, spiking from Rp 30,000 to as high as Rp 60,000 per kilogram as converters struggle to secure naphtha-derived feedstocks. Trade Minister Budi Santoso publicly acknowledged that the surge reflects geopolitical shocks affecting raw material supplies largely imported from the Middle East.
This commodity shock introduces massive operational friction for the enterprise. Unlike diversified FMCG companies, a pure-play bottled water operator cannot easily substitute its primary packaging material. The cost of the PET bottle, the cap, and the label often exceeds the cost of the water itself and the purification process.
Income Statement Dynamics: The 2025 Margin Compression
A forensic examination of the consolidated statement of profit or loss for the fiscal year ending December 31, 2025, reveals a narrative of sustained market share acquisition counterbalanced by acute cost-push inflation. The company reported consolidated net sales of Rp 2,825.63 billion, representing a structural top-line growth of 4.78% from the Rp 2,696.81 billion recorded in 2024.
This revenue generation was heavily supported by the Bottle segment, which generated Rp 1,573.00 billion (up 5.3% YoY), while the Non-bottle segment contributed Rp 1,202.13 billion (up 2.6% YoY). The “Others” segment, encompassing miscellaneous sales, contributed Rp 50.49 billion. Despite this resilient revenue expansion, the structural profitability of the firm faced substantial headwinds throughout 2025.
| Income Statement Highlights | FY 2024 (Rp) | FY 2025 (Rp) | Growth YoY |
|---|---|---|---|
| Net Sales | 2,696,813,747,786 | 2,825,631,197,247 | 4.78% |
| Cost of Goods Sold | (1,125,326,218,848) | (1,245,395,622,106) | 10.67% |
| Gross Profit | 1,571,487,528,938 | 1,580,235,575,141 | 0.56% |
| Selling Expenses | (780,552,357,723) | (891,922,274,428) | 14.27% |
| General & Admin Expenses | (131,083,955,525) | (141,333,524,892) | 7.82% |
| Finance Costs | (30,740,908,111) | (27,225,399,635) | -11.44% |
| Others – Net | (23,864,361,872) | (23,283,014,875) | -2.44% |
| Profit Before Tax | 604,839,392,838 | 496,084,609,119 | -17.98% |
| Income Tax Expense | (130,820,142,985) | (106,579,383,769) | -18.53% |
| Net Profit for the Year | 474,019,249,853 | 389,505,225,350 | -17.83% |
| Attributable to Owners | 465,157,220,395 | 381,820,570,794 | -17.91% |
The cost of goods sold (COGS) escalated disproportionately by 10.67%, significantly outpacing revenue growth. A detailed breakdown of the manufacturing expenses illustrates that this escalation was primarily driven by raw material consumption, which increased to Rp 690.21 billion from Rp 677.82 billion. Furthermore, amplified manufacturing overheads heavily burdened the COGS line. Factory electricity, water, and telephone costs surged by 15.4% to Rp 227.40 billion, while depreciation of newly capitalized property, plant, and equipment allocated to COGS jumped by 26.6% to Rp 113.11 billion.
| Cost of Goods Sold Breakdown | FY 2024 (Rp) | FY 2025 (Rp) |
|---|---|---|
| Raw Materials Used | 677,824,175,417 | 690,217,713,923 |
| Direct & Indirect Labor | 148,046,431,502 | 162,839,590,804 |
| Electricity, Water & Telephone | 197,052,999,478 | 227,402,622,402 |
| Depreciation of PPE | 89,328,418,355 | 113,111,224,394 |
| Repairs and Maintenance | 59,984,048,133 | 79,868,379,324 |
| Plant Operations | 41,285,091,285 | 49,873,990,504 |
| Transportation and Fuel | 26,078,281,017 | 27,607,900,965 |
| Total Cost of Production | 1,252,231,114,959 | 1,358,319,995,095 |
| Finished Goods Inventory Adj. | (29,738,615,802) | 532,729,106 |
| Reclassification of Gallons | (97,166,280,309) | (113,457,102,095) |
| Cost of Goods Sold | 1,125,326,218,848 | 1,245,395,622,106 |
Consequently, the gross profit margin experienced a compression, contracting to 55.92% in 2025 from a peak of 58.27% in 2024. While a gross margin in the mid-50s remains exceptionally robust for a fast-moving consumer goods operator—comparing favorably against peers like Akasha Wira International ($ADES) at 52.1%—the downward trajectory underscores the vulnerabilities inherent in operating a capital-intensive manufacturing network.
The margin compression at the gross level cascaded down the income statement, exacerbated by significant operational deleverage. Selling expenses surged by 14.27% to Rp 891.92 billion. This increase was fueled by aggressive labor cost expansion within the sales division (reaching Rp 403.15 billion), escalated transportation and fuel costs (Rp 204.89 billion) necessitated by the company’s expanding geographic footprint, and heightened advertising and promotional campaigns (Rp 119.37 billion) required to defend market share in an intensely competitive environment. General and administrative expenses also crept upward to Rp 141.33 billion.
This confluence of rising input costs and expanding operational outlays culminated in a notable 17.91% contraction in net profit attributable to the owners of the company, which fell from Rp 465.15 billion in 2024 to Rp 381.82 billion in 2025. The reported basic earnings per share diluted proportionately to Rp 15.91. The 2025 fiscal year clearly demonstrated the double-edged sword of the company’s localized manufacturing strategy: while building new plants secures long-term distribution advantages, the immediate spike in fixed overheads and depreciation acts as a severe drag on net margins until sufficient volume throughput is achieved.
The First Quarter 2026 Volume Resurgence
However, the initiation of the 2026 fiscal year demonstrated a powerful inflection point in the company’s top-line momentum. For the first quarter ending March 31, 2026, the enterprise recorded a stellar 15.8% year-over-year surge in net sales, achieving Rp 774.4 billion. This robust performance validates the massive capital expenditures deployed in the prior year, as the newly integrated production facilities allowed the company to capture the holiday-driven demand spike flawlessly.
The Bottle segment remained the primary growth engine, accelerating by 16.9% year-over-year to reach Rp 432.7 billion in quarterly revenue. Concurrently, the Non-bottle segment, largely consisting of the highly competitive returnable gallon business, demonstrated synchronized strength, growing 16.2% to Rp 325.7 billion. This balanced growth across both mass-market and premium product lines indicates excellent market penetration and brand resonance.
This aggressive volume expansion in 1Q26 allowed the company to regain a degree of operating leverage. Net profit for the first quarter of 2026 reached Rp 122.6 billion on a consolidated basis (with Rp 116.51 billion attributable to the parent entity), reflecting a robust year-over-year recovery. The gross margin for the quarter showed signs of stabilization at 58.1%, up sequentially from the depressed levels seen in late 2025. The net profit margin stood at a respectable 15.04%.
A critical question arises: how did the company manage to expand its gross margin to 58.1% in 1Q26 precisely when global PET resin prices were surging due to the Middle East conflict? The answer lies in the balance sheet’s working capital structure. The company maintains an extensive inventory buffer. With Rp 305.35 billion in inventory at the end of 2025 against an annualized COGS of roughly Rp 1.24 trillion, the firm holds approximately 89 days of inventory. Therefore, the plastic bottles consumed and sold during the first quarter of 2026 were manufactured using PET resin procured in late 2025 at significantly lower spot prices. The company effectively dodged the initial wave of the petrochemical inflation shock through inventory lag.
Balance Sheet Architecture and Asset Capitalization
An analysis of the company’s balance sheet reveals a highly capitalized, asset-heavy enterprise supported by a conservative and deeply resilient funding structure. Total assets expanded materially to Rp 3,018.78 billion as of December 31, 2025, up 13.3% from Rp 2,663.38 billion in 2024.
The asset base is overwhelmingly dominated by non-current assets, which totaled Rp 2,509.88 billion. Specifically, Property, Plant, and Equipment (PPE) amounted to Rp 2,362.94 billion, representing over 78% of the total asset base. This extreme concentration reflects the company’s strategic imperative to continually build and upgrade physical manufacturing infrastructure. A detailed review of the PPE schedule reveals massive gross additions during 2025: Rp 11.92 billion in new buildings, Rp 56.10 billion in machinery and plant equipment, and a staggering Rp 119.57 billion capitalized into gallons, glass bottles, and crates.
The capitalization of gallons is a unique accounting feature of the returnable water business. Because gallons are retrieved, washed, and reused over a multi-year lifespan, they are treated as fixed assets rather than inventory, depreciated over an estimated useful life of 2 to 5 years. Furthermore, the company reported Construction in Progress (CIP) of Rp 228.40 billion at the end of 2025, representing unfinished buildings and machinery installations primarily associated with the new Palu, Pontianak, and Pekanbaru facilities. The company also executed advance payments for future PPE purchases amounting to Rp 136.82 billion, underscoring that the capital expenditure cycle is far from complete.
In compliance with Indonesian Financial Accounting Standard (PSAK) 73 regarding leases, the company capitalized right-of-use assets for land, buildings, and vehicles totaling Rp 135.61 billion net of accumulated depreciation. This accounting treatment grosses up the balance sheet but accurately reflects the economic reality of the company’s long-term operational control over its logistical fleet and distribution hubs.
| Asset Highlights | FY 2024 (Rp) | FY 2025 (Rp) |
|---|---|---|
| Cash and Cash Equivalents | 48,041,777,363 | 32,314,178,392 |
| Trade Receivables (Net) | 95,874,666,266 | 120,511,019,611 |
| Inventories (Net) | 275,449,055,907 | 305,359,937,142 |
| Advances and Prepayments | 35,412,104,216 | 45,931,060,575 |
| Total Current Assets | 457,203,260,191 | 508,899,817,495 |
| Advances for PPE | 163,691,229,412 | 136,824,408,039 |
| Property, Plant & Equipment | 2,031,779,248,925 | 2,362,944,528,491 |
| Total Non-Current Assets | 2,206,183,746,721 | 2,509,885,777,189 |
| TOTAL ASSETS | 2,663,387,006,912 | 3,018,785,594,684 |
Working capital management demonstrates strict operational discipline. Trade receivables stood at Rp 120.51 billion at the end of 2025, representing an increase consistent with top-line revenue growth. The aging profile of these receivables is exceptionally healthy; out of a gross balance of Rp 124.01 billion, over Rp 98.99 billion is classified as not yet due, while only Rp 6.07 billion is past due by more than 90 days. The company applies a rigorous Expected Credit Loss model pursuant to PSAK 71, utilizing a provision matrix based on historical default rates adjusted for forward-looking economic indicators. Consequently, the firm maintains a conservative allowance for impairment of Rp 3.50 billion, indicating negligible credit risk exposure within its distributor network.
Liability Structure and Debt Covenant Management
The liability structure of the firm is characterized by prudent leverage and high solvency, a rarity for an enterprise undergoing aggressive physical expansion. Total liabilities contracted slightly to Rp 706.66 billion in 2025 from Rp 733.61 billion in the prior year.
The reliance on external bank debt is notably minimal. Total interest-bearing bank loans amounted to just Rp 350.91 billion. This debt portfolio comprises Rp 58.50 billion in short-term working capital loans (bearing an interest rate of 5.75%) and Rp 292.41 billion in long-term term loans (bearing 5.85%) sourced primarily from PT Bank Negara Indonesia (Persero) Tbk ($BBNI). The long-term term loans possess an 84-month tenor, including a 12-month grace period, perfectly matching the duration of the underlying factory assets they finance.
The company operates comfortably within its strict banking covenants imposed by Bank BNI, which mandate a current ratio above 1.0x, a debt-to-equity ratio below 2.5x, a debt service coverage ratio exceeding 100%, and a working capital coverage ratio above 125%. Failure to maintain these metrics could trigger technical defaults, restrict dividend payments, or halt further expansion. However, with a net debt-to-equity ratio of an exceptionally safe 17.06% at the end of 2025, the firm is nowhere near breaching these thresholds. This conservative capital structure shields the balance sheet from the direct impacts of Bank Indonesia’s interest rate fluctuations.
| Liability Highlights | FY 2024 (Rp) | FY 2025 (Rp) |
|---|---|---|
| Short-term Bank Loans | 100,600,000,000 | 58,500,000,000 |
| Trade Payables | 96,774,673,768 | 115,292,416,462 |
| Current Maturities of LT Debt | 74,980,000,008 | 74,980,000,008 |
| Total Current Liabilities | 379,826,463,148 | 326,305,467,460 |
| Long-term Bank Loans | 242,412,777,760 | 217,432,777,752 |
| Employee Benefit Liabilities | 21,246,929,096 | 21,775,967,587 |
| Deferred Tax Liabilities | 46,914,309,711 | 60,773,571,095 |
| Total Non-Current Liab. | 353,784,096,130 | 380,355,453,911 |
| TOTAL LIABILITIES | 733,610,559,278 | 706,660,921,371 |
Other notable liabilities include Trade Payables amounting to Rp 115.29 billion, of which Rp 27.93 billion is owed to related parties. Lease liabilities under PSAK 73 stood at Rp 42.01 billion, representing the discounted present value of future lease payments for distribution centers and logistical vehicles. Deferred tax liabilities expanded to Rp 60.77 billion, primarily arising from the temporary differences between the accelerated fiscal depreciation of property, plant, and equipment and the straight-line accounting depreciation recognized in the income statement.
The company also maintains a significant Employee Benefits Liability of Rp 21.77 billion, calculated by independent actuaries in accordance with PSAK 24 and the prevailing Indonesian Job Creation Law. The actuarial assumptions underlying this liability are realistic, utilizing a discount rate of 6.50% (down from 7.25% in 2024) and an expected annual salary increment of 5.00%. The sensitivity analysis indicates that a 1% decrease in the discount rate would escalate the net defined benefit obligation by roughly Rp 2.06 billion, highlighting the liability’s duration risk, though the absolute magnitude remains immaterial relative to the total balance sheet.
Equity Maneuvering and Capital Structure Optimization
Equity accumulation has been the primary driver of balance sheet expansion, effectively funding the aggressive plant build-out without leveraging the firm. Total equity attributable to the owners of the company surged to Rp 2,248.98 billion in 2025, fortified by the retention of Rp 1,698.04 billion in unappropriated retained earnings.
The company’s capital allocation strategy during 2025 included highly sophisticated equity maneuvering designed to enhance share liquidity and optimize the capital structure. In March and April of 2025, the company completely liquidated its treasury stock portfolio, selling 8.16 million and 31.85 million shares respectively back to its parent entity, PT Tancorp Global Abadi. This transaction generated Rp 51.58 billion in hard cash for the company and allowed the firm to recognize a Rp 32.95 billion premium, recorded directly into equity as additional paid-in capital rather than flowing through the income statement. This maneuver effectively allowed the parent company to inject non-debt liquidity directly into the operating subsidiary just as capital expenditures for the new factories were peaking.
Subsequently, during the Annual General Meeting of Shareholders on May 26, 2025, the firm executed a massive capitalization of its share premium. The company distributed 12 billion bonus shares to existing shareholders by capitalizing Rp 240 billion of additional paid-in capital. This corporate action effectively doubled the outstanding share count from 12 billion to 24 billion shares, maintaining the par value at Rp 20 per share, and raising the total issued and fully paid capital to Rp 480 billion. While this transaction does not alter the fundamental enterprise value or the proportionate ownership of any shareholder, it dramatically improves stock liquidity in the public float, signaling management’s confidence in the long-term compounding nature of the equity base and making the stock more accessible to retail investors.
Cash Flow Dynamics and Earnings Quality
A rigorous assessment of cash flow generation is imperative to validate the quality of reported earnings, particularly in asset-heavy manufacturing businesses where aggressive depreciation schedules and capitalization policies can obscure true economic profitability. The enterprise exhibits exceptional cash conversion characteristics at the core operating level.
For the fiscal year 2025, net cash generated from operating activities amounted to Rp 526.88 billion. When juxtaposed against the reported net profit of Rp 381.82 billion, this results in an operating cash flow to net income conversion ratio of 1.38x. This robust cash conversion is mechanically driven by the massive non-cash depreciation and amortization add-backs, which totaled Rp 259.44 billion for the year. The disparity unequivocally confirms that the reported earnings are emphatically supported by real, tangible cash generation, untainted by aggressive accrual accounting, premature revenue recognition, or working capital manipulation. The company collected Rp 3,112.74 billion in cash from customers, closely mirroring its net sales figure, proving the high quality of its receivables.
| Cash Flow Summary | FY 2024 (Rp) | FY 2025 (Rp) |
|---|---|---|
| Cash Receipts from Customers | 2,683,227,559,691 | 3,112,742,455,046 |
| Payments to Suppliers & Emp. | (1,582,796,285,914) | (1,991,856,798,813) |
| Net Cash from Operations | 555,505,460,964 | 526,887,475,054 |
| Acquisition of PPE | 499,493,278,407 | (362,468,777,478) |
| Advances for PPE | (84,318,299,252) | (55,263,723,461) |
| Net Cash used in Investing | (581,383,572,401) | (417,044,022,373) |
| Proceeds from Short-term Loans | 1,000,229,573,790 | 993,087,396,727 |
| Repayment of Short-term Loans | (1,073,029,558,790) | (1,035,187,396,727) |
| Repayment of Long-term Loans | (58,313,333,340) | (74,980,000,008) |
| Payment of Cash Dividends | (60,397,937,380) | (60,000,000,000) |
| Proceeds from Treasury Stock | – | 51,582,441,355 |
| Net Cash used in Financing | (151,191,883,815) | (125,619,702,432) |
| Net Decrease in Cash | (177,069,995,252) | (15,776,249,751) |
However, the narrative shifts significantly when transitioning from operating cash flow to free cash flow. The company’s relentless pursuit of capacity expansion exacts a heavy toll on its free cash generation. In 2025, the firm utilized Rp 417.04 billion in investing activities. This outflow was overwhelmingly dominated by Rp 362.46 billion in direct acquisitions of property, plant, and equipment, and an additional Rp 55.26 billion deployed as advances for future capital expenditures.
Consequently, the unlevered free cash flow for the year compressed to roughly Rp 109.84 billion. The ratio of capital expenditures to depreciation expense stands at a high 1.39x, clearly indicating that the firm is deploying capital for aggressive capacity expansion and technological upgrades rather than merely maintaining existing infrastructure. While a low free cash flow yield is standard for a growth-phase industrial compounder, it leaves the firm highly dependent on sustained high-volume sales to eventually justify the invested capital.
Financing cash flows further illustrate a disciplined approach to capital structuring. The company successfully executed massive gross short-term debt refinancing, drawing down Rp 993.08 billion while repaying Rp 1,035.18 billion, effectively optimizing its working capital facilities without ballooning its debt load. Long-term debt obligations were met with precision, including the scheduled repayment of Rp 74.98 billion in term loans and Rp 37.89 billion in lease liabilities. Despite the heavy capital expenditure requirements draining free cash, the business generated sufficient internal liquidity to reward shareholders, executing a cash dividend payment of Rp 60.00 billion (amounting to Rp 5 per share based on the pre-bonus share count) approved during the Annual General Meeting of Shareholders. The ultimate reduction in cash and cash equivalents by Rp 15.77 billion for the year is a calculated deployment of liquidity rather than a symptom of operational distress, leaving the firm with a functional ending cash balance of Rp 32.31 billion.
Operational Dependency and Procurement Vulnerabilities
An exhaustive assessment of the enterprise must scrutinize its dependency risks, particularly concerning related-party transactions. In Indonesian conglomerates, related-party dealings can often obfuscate true market economics, either by artificially inflating revenues through channel stuffing or by suppressing margins through inflated procurement costs.
For the fiscal year 2025, the company’s sales to related parties—such as PT CMN Internasional Indonesia and PT De Vasa Indonesia—amounted to a mere Rp 5.81 billion, representing just 0.21% of total net sales. This confirms that the company’s top-line revenue is entirely driven by authentic, arm’s-length third-party consumer demand rather than captive affiliated channels.
However, the supply chain presents a vastly different reality. The company relies heavily on entities under common control for its raw material procurement. In 2025, the firm executed purchases from PT Voda Indonesia (Rp 93.71 billion), PT Sukses Okindo Kurnia Abadi (Rp 56.16 billion), and PT Kencana Tiara Gemilang (Rp 23.37 billion). Total related-party purchases amounted to Rp 179.25 billion, representing 25.37% of the total raw material procurement for the year.
| Related Party Transactions | FY 2024 (Rp) | FY 2025 (Rp) |
|---|---|---|
| Sales to Related Parties | ||
| PT CMN Internasional Ind. | 1,722,153,324 | 3,836,231,865 |
| PT De Vasa Indonesia | 1,022,353,090 | 823,714,017 |
| Total Related Sales | 4,291,693,428 | 5,818,311,441 |
| % of Total Net Sales | 0.16% | 0.21% |
| Purchases from Related Parties | ||
| PT Voda Indonesia | 119,136,471,770 | 93,716,901,023 |
| PT Sukses Okindo Kurnia Abadi | 59,934,197,800 | 56,168,219,140 |
| PT Kencana Tiara Gemilang | 33,712,166,851 | 23,379,224,332 |
| Total Related Purchases | 222,862,420,778 | 179,250,416,379 |
| % of Total Purchases | 32.44% | 25.37% |
While this percentage has decreased from 32.44% in 2024, it still constitutes a significant dependency. PT Voda Indonesia and PT Kencana Tiara Gemilang are integral to the plastic packaging and injection molding supply chain. In a stable macroeconomic environment, this vertical integration within the broader Tancorp group ensures supply security and consistency. However, in the current environment of exploding global PET resin prices due to the Middle East conflict, this relationship will be severely tested.
If market spot prices for plastic packaging double, as reported in regional Indonesian markets in early 2026, the critical question becomes one of transfer pricing policy. Will these related manufacturing entities absorb the margin compression to shield the publicly traded water company, or will they pass the 100% cost inflation directly through to the company’s COGS at strictly arm’s length pricing? Given the fiduciary duties to minority public shareholders, one must assume the latter. Therefore, the related-party procurement structure offers no systemic immunity from the impending raw material shock; it merely guarantees availability, not price protection.
Additional operational friction was observed in the form of tax compliance issues. In September 2025, the company received several Tax Assessment Letters for underpayments dating back to the 2020 and 2021 fiscal years, encompassing Corporate Income Tax, VAT, and Withholding Taxes totaling over Rp 4.8 billion. While the absolute monetary value of these assessments is utterly immaterial to the company’s solvency, the clustering of retroactive tax audits suggests a need for enhanced administrative rigor within the finance department to prevent minor cash leakages from administrative penalties.
Valuation and Market Implications
Pricing the enterprise requires reconciling its identity as a high-growth consumer staple compounder against its profile as a highly capital-intensive commodity converter currently facing extreme supply chain headwinds. As of May 2026, the company’s equity trades on the Indonesia Stock Exchange at approximately Rp 390 to Rp 392 per share. Accounting for the expanded base of 24 billion outstanding shares following the recent bonus issue, this implies a total market capitalization of roughly Rp 9.36 trillion to Rp 9.40 trillion.
Line chart of Sariguna Primatirta Tbk (CLEO) with timeframe 1 Year.
Based on the trailing net income of Rp 381.82 billion generated in 2025, the stock trades at a Price-to-Earnings (P/E) multiple of approximately 24.5x. The Price-to-Book Value (PBV) stands at a steep 4.16x, supported by a strong Return on Equity (ROE) of 16.5% and an operational Return on Assets (ROA) of 12.6%.
Rp 392
MCap: 9.41 T
| Valuation Metrics | Current Value |
|---|---|
| Share Price (IDR) | 390 – 392 |
| Market Capitalization (IDR) | ~9.36 Trillion |
| Price-to-Earnings (P/E) | ~24.5x |
| Price-to-Book Value (PBV) | 4.16x |
| EV/EBITDA | ~12.7x |
| Dividend Yield | 1.28% |
At first glance, a 24.5x earnings multiple for a bottled water manufacturer appears to demand a premium valuation, particularly when compared to slower-growing regional peers. This premium is historically justified by the company’s impressive five-year revenue compound annual growth rate of 23.8%, which vastly outperforms broader beverage industry averages. The public markets are essentially pricing the company as a perpetual growth asset, anticipating that the aggressive deployment of capital into 35 decentralized manufacturing plants will continuously translate into double-digit volume expansion, economies of scale, and eventual massive free cash flow generation once the heavy capex cycle matures.
However, a fundamental disconnect emerges when evaluating this premium valuation against the immediate macroeconomic reality. The current market price leaves virtually no margin of safety for the impending margin contraction dictated by the global PET resin crisis. While the 1Q26 earnings demonstrated robust resilience—powered by an 89-day inventory buffer of cheap plastic and elevated holiday sales volumes—the market may be dangerously extrapolating this short-term outperformance linearly into the future.
The market is currently failing to account for the delayed, yet mathematically inevitable, transmission of the 100% surge in local packaging costs that will strike the COGS line in Q2 and Q3 of 2026 once the legacy inventory is depleted. If gross margins compress from their current 58% down toward the low 50s, and selling expenses remain sticky due to the necessity of defending market share through marketing and freight, the forward earnings yield will compress sharply. Consequently, the 24.5x multiple is highly vulnerable to a downward re-rating.
Furthermore, the enterprise value-to-EBITDA multiple, which normalizes for the heavy depreciation load of the business, hovers around 12.7x. This indicates that on a pure operating cash flow basis, the business is priced somewhat more reasonably than the headline P/E suggests. Yet, the abysmal free cash flow yield—a byproduct of deploying nearly all operating cash back into new plant construction—means that investors are almost entirely reliant on capital appreciation rather than dividend distributions for their total return. The company’s dividend yield sits at a meager 1.28%, offering minimal structural downside protection in the event of a broad market sell-off triggered by inflationary fears.
Investment Outlook
PT Sariguna Primatirta Tbk represents a masterclass in domestic supply chain execution, capital allocation, and relentless market penetration. The company’s strategic decision to build a vast, decentralized web of manufacturing facilities has established a formidable structural moat against logistical inefficiencies. This unique physical architecture allows the firm to deliver impressive top-line growth and capture market share in an exceptionally crowded and competitive industry, effectively circumventing the geographical constraints of the Indonesian archipelago. The balance sheet is a fortress of solvency, devoid of the toxic leverage that often plagues rapidly expanding emerging market industrials, and the quality of earnings is pristine, backed fully by robust, uncontingent operating cash flows.
However, the investment case must be framed as a highly conditional opportunity that presently warrants significant caution. The enterprise currently embodies a classic paradox: a high-quality business confronting an abysmal, largely uncontrollable macroeconomic setup. The violent escalation of geopolitical tensions in the Middle East has fractured the global petrochemical supply chain, resulting in a dramatic, sustained surge in the cost of PET resin and plastic packaging—the lifeblood of the company’s cost structure. Because the company operates with a high degree of fixed capital intensity due to its 35 factories, any contraction in its gross margin caused by these raw material spikes will cause a magnified, leveraged deterioration in operating profit.
At a valuation of 24.5x trailing earnings and over 4x book value, the public markets have priced the equity for absolute perfection. Investors are currently paying a premium for the successful execution of the national expansion strategy while seemingly ignoring the commodity cost tsunami rapidly approaching the income statement in the second half of 2026.
Therefore, while the company remains a structurally superior operator over a multi-year horizon, the immediate risk-reward asymmetry skews negative. The stock does not currently justify a premium entry point as it lacks a sufficient margin of safety. Institutional allocations should be firmly deferred until the full extent of the Q2 and Q3 2026 margin compression is recognized and digested by the market, resulting in a more rational valuation multiple. Alternatively, investment should be paused until management definitively proves, through subsequent quarterly filings, that it possesses the supreme pricing power required to seamlessly pass the hyper-inflation of plastic packaging directly onto the end consumer without fracturing its long-term volume growth trajectory.
Disclaimer
aluna Analytics is an independent research collective that operates without affiliation to any financial institution, broker, or advisory firm. We do not hold licenses as a securities dealer, investment advisor, or portfolio manager.
All materials published by aluna Analytics are created solely for informational and educational purposes. They reflect independent analytical interpretation and should not be regarded as personalized investment advice, solicitation, or endorsement of any security or strategy.
Market data, opinions, and projections presented herein are subject to change and may not predict future results. Readers remain fully responsible for any financial decisions made based on the information provided. We strongly encourage conducting personal due diligence and consulting a licensed professional before making investment commitments.
aluna Analytics is not regulated by the Financial Services Authority of Indonesia (OJK) and does not offer investment management or brokerage services. All content is presented in good faith, aiming to foster research literacy and informed market perspectives.