



Author: aluna Analytics | Date: 28 April 2026 | Category: Market Intelligence
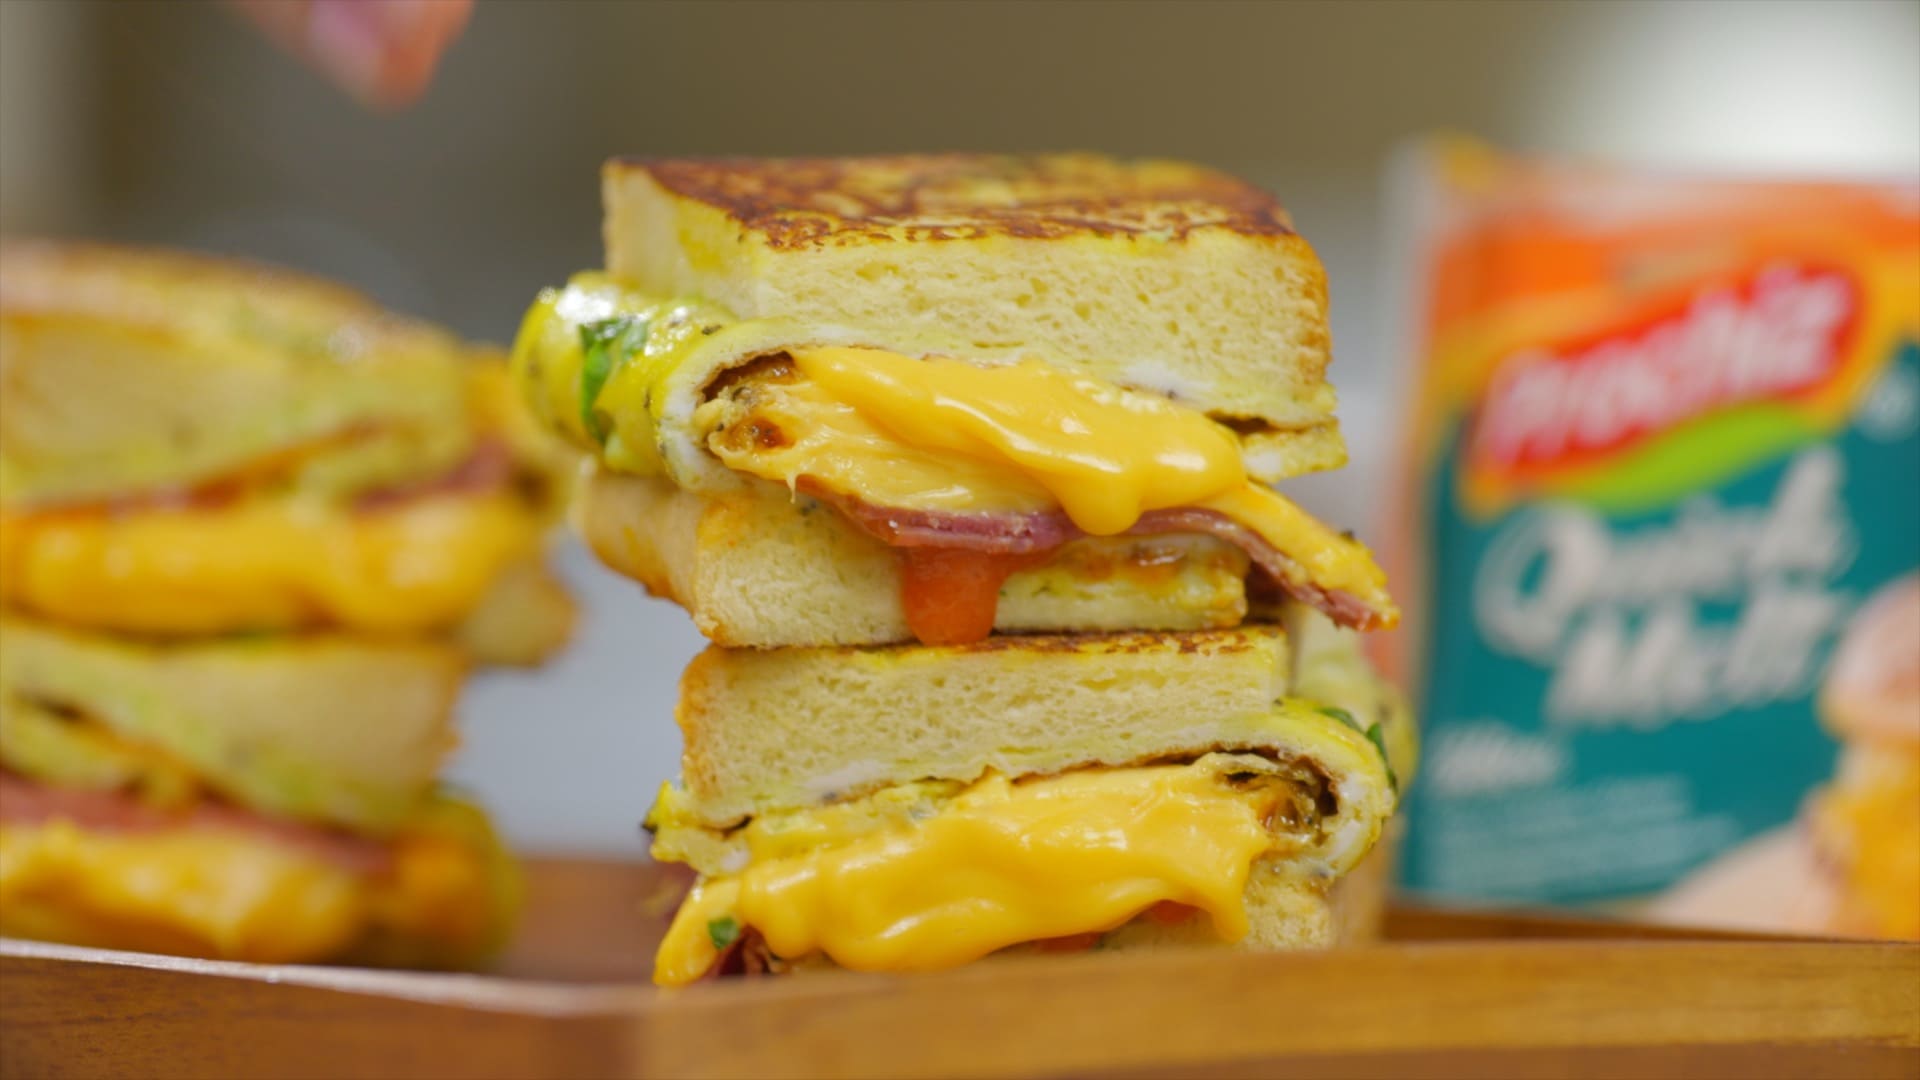
PT Mulia Boga Raya Tbk ($KEJU) stands as the dominant domestic entity within the Indonesian processed cheese and dairy-derivative market. Established in 2006 and having commenced commercial operations in July 2008, the enterprise has methodically constructed a formidable economic moat around its flagship “Prochiz” and “Topchiz” brand architectures. By engineering products specifically tailored to the ambient temperature storage requirements and distinct flavor profiles of the Indonesian culinary landscape, deep penetration has been achieved into both the retail consumer segment and the commercial food service industry. The financial disclosures for the first quarter ended 31 March 2026 reveal an enterprise experiencing explosive top-line volume growth, heavily catalyzed by seasonal consumption tailwinds, yet simultaneously navigating an acute compression in gross profitability driven by an unforgiving global raw material pricing environment.
An exhaustive, forensic examination of the financial condition, business profile, and underlying economic engine transcends a mere recitation of statutory figures, prioritizing the identification of fundamental cause-and-effect relationships within the income statement, balance sheet, and cash flow statement. By isolating structural operational performance from temporary macroeconomic distortions, it becomes possible to accurately evaluate the durability of margins, the high-quality nature of the cash conversion cycle, and the scalability of the enterprise’s infrastructure. Furthermore, profound strategic implications emerge from the deeply intertwined relationship with the parent entity, PT Garudafood Putra Putri Jaya Tbk ($GOOD), and the newly solidified partnership with the global dairy conglomerate Bel S.A.
The overarching narrative that emerges from the first quarter of 2026 is one of a high-quality, capital-efficient compounder operating at the intersection of massive demographic tailwinds and severe short-term supply chain friction. Robust operating cash flows were successfully generated that vastly exceeded reported net income, while a fortress balance sheet characterized by absolute zero interest-bearing debt and abundant liquidity was maintained. However, the inability to immediately pass through surging imported raw material costs to the end consumer has exposed a latent vulnerability in autonomous pricing power, leading to a stark divergence between revenue expansion and gross profit realization.
Chart Error: API Error (Yahoo Chart): Not Found
Business Profile, Core Economic Engine, and Competitive Moat
To accurately interpret the financial statements, the mechanics of how the enterprise generates economic value must first be dismantled. The operation does not function as a traditional dairy farm or a purveyor of artisanal, aged cheeses; rather, it operates as a highly efficient manufacturer of processed, functionally optimized dairy ingredients designed for a developing market infrastructure. The product portfolio is segmented into cheddar block cheese, sliced cheese, and an “others” category comprising spreadable cheese, mayonnaise, and cheese-based snacks. The core economic engine of the business is undoubtedly the block cheese segment, which serves as a highly versatile culinary ingredient utilized extensively by local bakeries, street food vendors, quick-service restaurants, and domestic households.
In the unique context of Indonesian gastronomy, cheese is frequently deployed as a savory topping for sweet dishes, traditional baked goods, and modern fusion cuisine, rather than being consumed as a standalone premium item or paired with wine as seen in Western markets. This distinct usage pattern provides a structural competitive advantage. Proprietary formulations are explicitly engineered for specific melting points, ambient shelf stability in a tropical climate, and localized taste preferences, creating a product-market fit that imported European or Australian natural cheeses struggle to replicate at a competitive price point. The economics of the business are fundamentally driven by raw material transformation. Dairy solids are imported, specifically skim milk powder and whole milk powder, alongside other formulation ingredients, and processed through highly automated manufacturing facilities located in the Bekasi International Industrial Estate in West Java.
The value addition occurs through proprietary blending, aggressive brand positioning, and mass distribution. From a scalability perspective, the business model exhibits tremendous operating leverage. Once the fixed costs of the manufacturing facility and the foundational brand equity are established, incremental volumes can be pushed through the distribution network with minimal marginal overhead cost, provided that the raw material pricing spread remains favorable. Distribution reach is unparalleled in the domestic cheese category, leveraging a network of modern retail supermarkets, traditional wet markets, and e-commerce platforms to ensure ubiquitous product availability.
The strategic positioning underwent a massive structural evolution with recent ownership realignments. PT Garudafood Putra Putri Jaya Tbk remains the controlling shareholder, holding a 66.07% equity stake representing over 3.7 billion shares. However, the introduction of the French dairy group Bel S.A. as a joint controlling shareholder fundamentally alters the long-term trajectory. Bel S.A. acquired a 22.5% minority stake in August 2025 by purchasing 1.26 billion shares at a valuation of Rp 560 per share, totaling an investment of Rp 708.75 billion. Bel S.A., renowned globally for iconic brands such as The Laughing Cow, Kiri, and Babybel, brings unparalleled research and development capabilities, global procurement scale, and advanced cheese-making expertise.
This synergistic alliance perfectly marries Bel’s upstream technological prowess with the downstream distribution dominance of the Garudafood ecosystem. Theoretically, this positions the enterprise to dominate both its legacy mass-market cooking cheese segment and the higher-margin, rapidly growing premium snacking cheese category in the coming years. By jointly setting financial and operational policies, the new ownership structure mitigates the risks of stagnation and provides a clear roadmap for premiumization and category expansion, significantly widening the economic moat against domestic challengers like Emina Cheese and international incumbents like Kraft Heinz.
Macroeconomic Tailwinds and Industry Crosscurrents
The financial performance in the first quarter of 2026 cannot be isolated from the broader macroeconomic environment and industry-specific crosscurrents. The most immediate catalyst for the exceptional top-line performance was the timing of the Islamic holy month of Ramadan, which commenced in late February 2026, followed by the Eid al-Fitr celebrations in March. In Indonesia, this period triggers a massive, systemic surge in consumer spending, particularly in the fast-moving consumer goods and food sectors. Retail sales data indicated a robust 6.9% year-on-year increase in February, with food and beverage spending growing by 8.3% as households accumulated supplies for daily fast-breaking rituals and festive meals. Processed cheese, heavily utilized in festive baking, dessert preparation, and celebratory culinary applications, experiences a disproportionate demand shock during this window, effectively pulling forward a massive percentage of annual consumption into the first quarter.
Beyond these seasonal anomalies, a profound, secular demographic wave is underway. Indonesia possesses a population exceeding 275 million people, characterized by a rapidly expanding middle class and increasing exposure to Westernized dietary habits driven by urbanization and digital media consumption. Despite these favorable demographics, the per capita consumption of cheese in Indonesia remains exceptionally low, recorded at a mere 0.35 kilograms annually as of recent measurements. This extremely low base effect provides an immense, multi-decade runway for structural growth. As urbanization continues and disposable incomes rise, dietary shifts toward higher protein and dairy consumption are inevitable, transitioning cheese from a discretionary luxury to a household staple.
Furthermore, the national policy landscape has shifted favorably toward the dairy industry. The implementation of the Free Nutritious Meals program by the Indonesian government has elevated the strategic importance of milk and dairy derivatives at the state level. While the program initially faced challenges with purchasing power, the overarching national focus on dairy consumption normalizes the category and accelerates the integration of dairy into the daily Indonesian diet. The Ministry of Agriculture’s initiative to import one million dairy cattle to rebuild the national herd following the devastating Foot and Mouth Disease outbreaks further underscores the government’s commitment to the sector. While reliance is placed heavily on imported dairy powders rather than fresh domestic liquid milk, any policy that fosters a dairy-consuming culture inherently benefits the long-term total addressable market.
However, the macroeconomic environment presents severe challenges on the supply side, creating a highly volatile operating theater. Global dairy commodity prices, particularly for skim milk powder and whole milk powder, experienced significant upward pressure leading into the first quarter of 2026. The Food and Agriculture Organization (FAO) Dairy Price Index registered a 1.2% increase in March 2026, reaching 120.9 points, driven by higher quotations for milk powders. While total global milk production is forecast to increase by a marginal 0.2% in 2026, the specific high-protein derivatives required for processed cheese manufacturing have seen profound price resilience, squeezing the margins of downstream processors globally.
Compounding the global commodity inflation is the domestic inflation environment. The Indonesian inflation rate decreased slightly to 3.48% in March 2026 from 4.76% in February, but core inflation—which strips out volatile food and administered prices—rose to 2.63%, indicating persistent underlying price pressures in the economy. Additionally, the Indonesian Rupiah’s exchange rate dynamics against the US Dollar and the Euro play a critical role. Because a substantial portion of specialized raw materials are imported, the cost structure is highly exposed to foreign exchange volatility. A weakening Rupiah simultaneously inflates the cost of imported milk powder while revenue is generated entirely in domestic currency, creating a structural mismatch that tests the resilience of gross margins.
Top-Line Performance: Revenue Acceleration and Segment Analysis
The income statement for the three-month period ended 31 March 2026 presents a fascinating study in commercial execution and distribution power. Consolidated net sales of Rp 475.54 billion were reported, representing an explosive 28.9% increase over the Rp 368.73 billion reported in the corresponding period of 2025. This revenue acceleration is a testament to the sheer logistical force of the distribution network and the successful capturing of the Ramadan demand spike. The growth was broad-based, indicating that the Prochiz brand continues to gain market share and consumer mindshare across all product categories.
| Operating Segment | Net Sales Q1 2026 (Rp) | Net Sales Q1 2025 (Rp) | YoY Growth | Gross Profit Q1 2026 (Rp) | Gross Profit Q1 2025 (Rp) |
|---|---|---|---|---|---|
| Block Cheese | 369,387,471,828 | 294,001,166,603 | +25.6% | 97,862,325,798 | 98,574,975,011 |
| Sliced Cheese | 97,514,616,096 | 70,398,327,879 | +38.5% | 25,712,553,723 | 20,904,738,478 |
| Others | 8,635,354,072 | 4,332,057,157 | +99.3% | 913,420,186 | 280,738,311 |
| Total Consolidated | 475,537,441,996 | 368,731,551,639 | +28.9% | 124,488,299,707 | 119,760,451,800 |
The foundational block cheese segment, which dictates the overall trajectory, grew by a highly impressive 25.6%, reaching Rp 369.39 billion. This segment remains the undisputed volume driver, catering to both retail consumers making bulk purchases for holiday baking and commercial food service operators experiencing heightened seasonal footfall. However, the sliced cheese segment demonstrated even faster momentum, surging 38.5% to Rp 97.51 billion. Sliced cheese typically commands a higher price per gram and is heavily associated with convenience-oriented consumption, such as breakfast sandwiches and quick snacks, indicating successful penetration into daily consumption habits beyond specialized baking applications. The “Others” segment, which includes mayonnaise and spreadable cheese, nearly doubled to Rp 8.64 billion, albeit from a very low base, suggesting successful cross-selling and product line diversification.
A critical analysis of the revenue streams reveals an extreme concentration in customer distribution. Of the Rp 475.54 billion in net sales generated in the first quarter of 2026, a staggering Rp 380.5 billion—or 80.02% of total revenue—was derived from a single related-party entity: PT Sinarniaga Sejahtera (SNS). SNS serves as the primary distribution arm for the parent group, handling the complex logistical deployment and retail placement of cheese products across the vast and highly fragmented Indonesian archipelago. This relationship is fundamentally symbiotic but carries immense dependency risk. On the positive side, it grants immediate, frictionless access to one of the most extensive fast-moving consumer goods distribution networks in Southeast Asia, guaranteeing product placement in modern hypermarkets, minimarkets, and traditional trade outlets.
Export sales, while a secondary focus, demonstrated steady stability, with net revenue of Rp 27.7 billion derived from overseas customers, compared to Rp 27.1 billion in 2025. This indicates that while the domestic Indonesian market remains the primary growth engine, the Prochiz brand maintains a durable footprint in neighboring Asian markets, providing a small but valuable hedge against domestic economic downturns. Furthermore, total sales incentives and discounts of Rp 75.3 billion were recorded during the quarter, a significant increase from Rp 57.5 billion in 2025. These contra-revenue accounts demonstrate the aggressive promotional discounting required to move massive volumes through the retail channel during Ramadan, highlighting the intensely competitive nature of the packaged food retail environment.
Margin Dynamics and Cost Structure: The Commodity Squeeze
While the top-line revenue narrative is one of unmitigated success, moving down the income statement reveals a stark deterioration in the unit economics of the business. The cost of goods sold (COGS) ballooned by an alarming 41.0%, rising from Rp 248.9 billion in Q1 2025 to Rp 351.0 billion in Q1 2026. Because the cost of goods sold expanded at a significantly faster trajectory than top-line revenue, a severe gross margin compression was suffered. Gross profit for the quarter landed at Rp 124.49 billion, a marginal 3.9% increase over the Rp 119.76 billion achieved in the prior year. Expressed as a percentage, the gross margin collapsed from a highly lucrative 32.5% in Q1 2025 to a concerning 26.2% in Q1 2026.
| Cost of Goods Sold Component | Q1 2026 (Rp) | Q1 2025 (Rp) | YoY Change |
|---|---|---|---|
| Raw Materials Used | 291,479,473,350 | 207,890,790,006 | +40.2% |
| Direct Labor | 10,848,140,123 | 10,768,119,633 | +0.7% |
| Indirect Labor | 10,623,947,604 | 3,897,610,779 | +172.5% |
| Depreciation | 5,162,949,426 | 5,964,889,807 | -13.4% |
| Utilities | 5,076,031,359 | 4,115,712,824 | +23.3% |
| Repair and Maintenance | 3,986,918,042 | 2,905,145,403 | +37.2% |
Deconstructing the cost of sales provides absolute analytical clarity on the root cause of this margin hemorrhage. The cost of raw materials used spiked dramatically, surging by 40.2%. This single line item is the undisputed culprit behind the gross margin collapse. In stark contrast, direct labor costs remained entirely flat, moving marginally from Rp 10.77 billion to Rp 10.85 billion. This specific variance confirms two critical aspects of the business: first, the manufacturing process is highly automated and scalable, requiring virtually no incremental direct labor to produce 28.9% more revenue; second, the margin compression is entirely a function of exogenous commodity input inflation rather than systemic internal operational inefficiencies.
The reliance on global dairy powder pricing is a structural vulnerability. Major suppliers such as PT Kerry Ingredients Indonesia and Fonterra Limited accounted for Rp 141.3 billion in cumulative purchases during the quarter, representing an immense concentration of supply chain exposure to international dairy conglomerates. The inflation in skim milk powder and whole milk powder, combined with potential foreign exchange headwinds, forced the absorption of massive input cost increases.
A segment-level analysis of profitability further illuminates the issue. The gross profit of the flagship block cheese segment actually declined in absolute terms, falling from Rp 98.57 billion in Q1 2025 to Rp 97.86 billion in Q1 2026, despite generating Rp 75 billion in additional sales. This implies that the entire volume growth in block cheese was effectively profitless on a gross basis. The sliced cheese segment performed slightly better, expanding its gross profit from Rp 20.90 billion to Rp 25.71 billion, indicating slightly superior pricing power or a more favorable formulation mix.
The inability to protect the gross margin suggests a temporary, but acute, absence of pricing power. In the fast-moving consumer goods sector, passing volatile commodity spikes to the end consumer is notoriously difficult, especially during culturally sensitive periods like Ramadan, where price elasticity is high and retail pricing is intensely scrutinized by price-sensitive households. A strategic decision was likely made, in coordination with the distributor SNS, to absorb the raw material inflation to protect market share, ensure maximum volume throughput, and maintain a dominant position on retail shelves. While this strategy successfully drove top-line growth, it exposed the limits of autonomous pricing leverage in the face of supply shocks.
Operating Expense Optimization and Profitability Protection
Faced with a collapsing gross margin, the management team executed a masterclass in operating expense control to salvage the bottom line. General and administrative (G&A) expenses were aggressively rationalized, dropping by 18.0% from Rp 25.55 billion to Rp 20.95 billion. This reduction was not achieved through draconian headcount reductions—as salaries and employee benefits remained completely flat at Rp 13.77 billion—but rather through a steep and targeted cut in professional fees, which fell precipitously from Rp 7.99 billion to Rp 3.19 billion. This indicates that the elevated professional fees in 2025 were likely non-recurring, potentially related to consulting services for the Bel S.A. acquisition integration, supply chain optimization studies, or the engineering planning for the new Sumedang factory.
| Operating Expenses | Q1 2026 (Rp) | Q1 2025 (Rp) | YoY Change |
|---|---|---|---|
| Selling Expenses | 34,872,374,958 | 29,616,105,500 | +17.7% |
| – Advertising and Promotion | 17,096,927,417 | 15,301,770,118 | +11.7% |
| – Salaries and Benefits | 8,535,499,460 | 7,225,083,955 | +18.1% |
| – Freight | 4,499,676,041 | 3,368,186,268 | +33.5% |
| General & Administrative | 20,953,384,877 | 25,549,498,665 | -18.0% |
| – Salaries and Benefits | 13,771,741,314 | 13,876,017,425 | -0.7% |
| – Professional Fees | 3,193,233,697 | 7,989,209,083 | -60.0% |
Selling expenses grew by 17.7% to Rp 34.87 billion. Crucially, this growth rate is notably slower than the 28.9% revenue growth, indicating excellent marketing efficiency and positive operating leverage over the fixed promotional infrastructure. Advertising and promotion expenses grew rationally by 11.7% to Rp 17.10 billion to support the Ramadan marketing push. Freight costs increased by 33.5%, directly mirroring the volume growth and reflecting the logistical intensity of nationwide distribution during a peak holiday season.
As a direct consequence of this stringent operating expense management, a profit before income tax of Rp 70.7 billion was posted, marginally higher than the Rp 70.2 billion recorded in Q1 2025. Income tax expenses remained stable at Rp 15.1 billion, resulting in a net profit for the period of Rp 55.6 billion, nearly identical to the Rp 55.5 billion achieved in the prior year. The fundamental takeaway from the income statement is that flat earnings were manufactured out of a severe margin crisis by leaning heavily on top-line volume and ruthless corporate cost-cutting. While commendable in the short term, this reliance on operating leverage below the gross profit line is mathematically finite. Long-term earnings growth will strictly require a normalization of the gross margin spread, either through a deflationary turn in global milk powder prices or the successful implementation of retail price increases.
Cash Flow Conversion and Earnings Quality Assessment
The true measure of a company’s financial health frequently lies obscured behind accrual accounting, making the statement of cash flows the ultimate arbiter of business quality and sustainability. The cash flow dynamics in the first quarter of 2026 were exceptionally strong, highlighting the high-quality nature of reported earnings and demonstrating the immense cash-generating capacity of core operations. An impressive Rp 117.09 billion in net cash from operating activities was generated, an amount more than double the reported net income of Rp 55.6 billion. This massive positive divergence between operating cash flow and accounting profit is the hallmark of a structurally sound business and warrants deep forensic investigation into the working capital mechanics.
| Cash Flow Highlights | Q1 2026 (Rp) | Q1 2025 (Rp) |
|---|---|---|
| Cash Receipts from Customers | 507,706,331,724 | 334,089,496,371 |
| Cash Paid to Suppliers | (324,365,717,002) | (183,662,430,527) |
| Cash Paid to Employees | (52,458,241,596) | (35,149,838,868) |
| Net Cash from Operating Activities | 117,097,288,320 | 114,477,468,746 |
| Net Cash Used in Investing Activities | (81,815,117,815) | (5,548,050,571) |
| Net Cash Used in Financing Activities | (3,477,346,914) | – |
| Net Increase in Cash and Banks | 31,804,823,591 | 108,929,418,175 |
The primary driver of this exceptional cash conversion was a highly efficient release of working capital. Cash receipts from customers surged to Rp 507.71 billion, vastly exceeding the reported net sales of Rp 475.54 billion. This indicates excellent collection velocity and the successful realization of receivables generated in the previous quarter. Furthermore, inventory balances were deliberately and successfully drawn down from Rp 318.3 billion at the end of 2025 to Rp 287.0 billion by 31 March 2026, injecting over Rp 31 billion of liquidity directly into the business. This inventory reduction perfectly aligns with the anticipated seasonal demand surge; raw materials and finished goods were clearly accumulated in the fourth quarter of 2025 to meet the massive Ramadan fulfillment requirements in the first quarter of 2026, and successfully liquidated for cash.
Simultaneously, the accrual base was expanded significantly, with total accruals rising from Rp 125.5 billion to Rp 174.5 billion, predominantly driven by unpaid advertising and promotional liabilities which spiked to Rp 147.3 billion. By effectively financing the seasonal marketing push through supplier credit and stretching payables, the working capital cycle was optimized, keeping cash inside the business to fund expansion.
Robust operating cash flows were successfully generated that vastly exceeded reported net income, while a fortress balance sheet characterized by absolute zero interest-bearing debt and abundant liquidity was maintained.
However, the cash flow statement also reveals aggressive capital deployment that dictates the future growth trajectory. Net cash used in investing activities expanded dramatically to Rp 81.81 billion, compared to a mere Rp 5.54 billion in the prior year. This massive outflow was primarily composed of Rp 56.0 billion in direct purchases of fixed assets and Rp 25.9 billion allocated to the acquisition of other non-current assets. This capital expenditure is tied directly to the construction of a state-of-the-art manufacturing facility in Cimanggung, Sumedang, West Java. The scale of this construction is clearly visible on the balance sheet, with capital allocated to buildings under construction rising to Rp 200.6 billion and machinery in progress reaching Rp 37.1 billion.
The targeted completion and operational commencement of this Sumedang facility in July 2026—a timeline reportedly accelerated ahead of initial estimates—represents a massive strategic bet. The total investment is estimated at Rp 691.65 billion (approximately USD 44 million). While this heavy capital absorption depresses free cash flow in the immediate term, it establishes the physical infrastructure necessary to effectively double production capacity, achieve new economies of scale, and defend market share against deep-pocketed regional competitors in the coming decade.
Financing cash flows were minimal, characterized solely by a Rp 3.47 billion outflow allocated to the acquisition of treasury shares. The profound absence of any new debt issuance or debt repayment cash flows confirms that the aggressive, multi-million dollar capacity expansion is being entirely self-funded through internally generated operating cash flow. This is a remarkable feat that speaks volumes about the underlying profitability and cash-generating power of the legacy asset base. The net result of these cash movements was a Rp 31.8 billion increase in absolute cash and bank balances, elevating the total liquidity pool to a highly secure Rp 290.5 billion.
Capital Allocation and Balance Sheet Architecture
The balance sheet as of 31 March 2026 is a study in extreme financial conservatism, providing an ironclad foundation for future expansion. Total assets stood at Rp 1.32 trillion, supported by a massive equity base of Rp 897.7 billion and total liabilities of Rp 428.9 billion. The most striking feature of the liability structure is the absolute zero reliance on interest-bearing debt. The enterprise possesses no bank loans, no corporate bonds, and no short-term financing facilities drawn, despite having access to nearly Rp 730 billion in various untapped credit facilities from major institutions.
Specifically, a Rp 170 billion term loan facility and a Rp 20 billion overdraft facility are maintained with PT Bank Danamon Indonesia Tbk, alongside a Rp 50 billion working capital facility with Citibank N.A., and a massive Rp 400 billion capital expenditure financing facility with PT Bank Negara Indonesia (Persero) Tbk. All of these facilities sat completely undrawn. This zero-debt capital structure is highly characteristic of the parent corporate philosophy, prioritizing survival and self-sufficiency over the theoretical optimization of the weighted average cost of capital through leverage. While a corporate finance purist might argue that an inefficient capital structure is being utilized by ignoring tax shields and cheaper funding costs associated with debt, the practical reality is that this unlevered balance sheet renders operations impervious to domestic interest rate shocks, credit market freezes, or sudden currency devaluations that frequently cripple emerging market corporates.
The liquidity profile is impeccable. The current ratio stands at an immensely healthy 1.84x, with Rp 788.3 billion in current assets easily overwhelming Rp 427.2 billion in current liabilities. Cash is diversified across major banking institutions, with Rp 142.9 billion held at PT Bank Maybank Indonesia Tbk and Rp 95.9 billion at PT Bank Danamon Indonesia Tbk, mitigating counterparty risk.
Capital allocation decisions reflect a management team highly confident in cash-generating ability and deeply committed to shareholder returns. During the first quarter, a share buyback program was actively executed, repurchasing over 7 million treasury shares at an average price of Rp 590 per share, signaling to the market that internal models view the equity as undervalued. Furthermore, post-reporting period disclosures indicate that the Annual General Meeting held on 21 April 2026 approved a massive cash dividend of Rp 89.88 billion, equating to a 50.09% payout ratio against the 2025 net profit, scheduled for payment on 13 May 2026. This yield commitment, combined with ongoing share repurchases, demonstrates exceptional capital discipline; a massive factory expansion is being funded, over half of earnings are being returned to shareholders, and absolute cash balances are simultaneously growing.
The equity structure was also significantly modified in early 2025 through the capitalization of additional paid-in capital, resulting in a massive bonus share distribution of 4.12 billion shares. This accounting maneuver increased the outstanding share count to 5.62 billion shares without altering the fundamental economic value of the enterprise. This was likely executed to increase stock liquidity, lower the nominal share price, and broaden the retail investor base on the Indonesia Stock Exchange. Retained earnings remain the dominant engine of the balance sheet, totaling over Rp 613 billion (including appropriated reserves), a testament to nearly two decades of uninterrupted profitable compounding.
Strategic Alliance and Parentage Dependency: Bel S.A. and Garudafood
Operational reality is deeply shaped by parentage. The business does not operate as a standalone, independent entity in the open market; it is deeply woven into the fabric of the $GOOD ecosystem and, increasingly, the global Bel S.A. infrastructure. The integration dictates the fundamental architecture of the supply chain and revenue realization. As previously established, 80.02% of total net sales are routed through PT Sinarniaga Sejahtera (SNS), an entity under common control.
This concentration is further entrenched through shared services agreements. Renewed Shared Services Agreements with SNS, PT Tudung Putra Putri Jaya, and PT Triteguh Manunggal Sejati cover compensation benefits and operating expenses. Furthermore, office space at Wisma Garudafood is leased from the parent company, and temporary storage warehouses are leased from SNS. While these agreements provide immediate operational synergies and eliminate the need for redundant corporate overhead, they require continuous monitoring by minority shareholders to ensure transfer pricing remains at arms-length and value is not structurally extracted via intra-group fees.
The introduction of Bel S.A. as a 22.5% minority shareholder fundamentally upgrades the strategic narrative. Bel S.A. is not merely a passive financial investor; it is a global dairy titan seeking to establish a massive footprint in Southeast Asia. The acquisition was explicitly framed as a strategic partnership designed to accelerate the development of the cheese business in Indonesia by leveraging Bel’s expertise in cheese and cheese-based snacks. Currently, reliance is high on utilitarian block cheese used for cooking and baking. Bel S.A., with its portfolio of Bel Cube and The Laughing Cow, possesses the precise technological know-how to pivot toward the highly lucrative, direct-to-consumer snacking cheese market. This product diversification is essential for long-term margin expansion, as snacking cheeses command significantly higher retail price points and are less commoditized than bulk cooking cheese. The success of this synergy will dictate evolution into a regional dairy powerhouse.
Latent Vulnerabilities, Financial Risks, and Contingent Liabilities
Despite the fortress balance sheet and operational dominance, a deep forensic review reveals several latent vulnerabilities and contingent liabilities that present tangible risks to shareholder value. The most pressing hidden vulnerability exists within the realm of taxation. A high-stakes tax dispute is currently engaged with the Indonesian Directorate General of Taxes. In April 2024, a tax assessment letter was received claiming an underpayment of corporate income tax for the 2022 fiscal year amounting to Rp 43.37 billion. The enterprise, having originally claimed an overpayment of Rp 945 million, vehemently rejected the assessment and filed an objection, which was subsequently denied by the Tax Office in April 2025. The matter was escalated by filing a formal appeal to the Tax Court in July 2025, the results of which remained pending as of 28 April 2026.
While the Rp 290.5 billion cash pile guarantees an adverse ruling can be effortlessly absorbed without risking insolvency, a Rp 43.3 billion cash outflow would represent a massive, one-time destruction of shareholder value, equivalent to nearly a full quarter of normalized net income. The explicit lack of a provision for this specific liability on the balance sheet indicates management’s high conviction in winning the appeal, but the binary risk remains unquantified and poses a sudden downside shock to the equity valuation.
Currency mismatch presents a second vector of risk. While operations are almost exclusively in Indonesia, generating Rupiah-denominated revenue, a vast majority of dairy raw materials are procured from international markets, necessitating payments in US Dollars and Euros. An analysis of net monetary assets reveals a natural hedge is maintained; Rp 48.5 billion equivalent in US Dollar cash was held against only Rp 13.2 billion equivalent in foreign currency trade payables at the end of the quarter. Consequently, a sudden depreciation of the Rupiah would theoretically result in a net translation gain on the balance sheet. However, this accounting gain masks the true economic pain of currency depreciation, which permanently elevates the baseline cost of imported milk powder in subsequent inventory cycles, directly exacerbating the gross margin pressures already evident.
Lastly, defined benefit pension obligations demonstrate an area of exceptional risk mitigation that contrasts with typical emerging market corporate behavior. In a landscape where many Indonesian corporates carry massive, unfunded post-employment liabilities, plan assets have been diligently funded under a Dana Pensiun Lembaga Keuangan (DPLK) structure with Allianz. Against a present value obligation of Rp 21.3 billion—calculated using a rigorous 7.00% discount rate and a 5.50% future salary increase assumption—Rp 20.9 billion in dedicated plan assets are held, comprised mostly of cash equivalents and equity instruments. This leaves an immaterial net liability of Rp 324 million on the balance sheet. A sensitivity analysis reveals that a 1% decrease in the discount rate would increase the liability by Rp 2.0 billion, a highly manageable variance that highlights a culture of financial prudence.
Valuation Considerations and Relative Market Attractiveness
Contextualizing financial performance requires a transition from historical accounting to forward-looking valuation logic. Based on market data available as of late April 2026, equity traded at approximately Rp 550 per share, translating to a market capitalization of roughly Rp 3.09 trillion. When evaluated against trailing twelve-month earnings per share of Rp 31.90, the stock trades at a normalized price-to-earnings (P/E) multiple of 17.5x. The price-to-book (P/B) ratio stands at an elevated 3.7x, reflecting the asset-light, high-return nature of the historical business model prior to the heavy Sumedang capital expenditures.

Mulia Boga Raya Tbk PT
Industrials
Rp 590
MCap: 3.32 T
A 17.5x trailing earnings multiple for an emerging market consumer staples business demands a critical assessment of future growth durability. On the surface, this multiple implies that the market is willing to pay a premium for dominant market share, exceptional return on equity (22.7%), and structural tailwinds in Indonesian dairy consumption. Furthermore, the 50% dividend payout ratio—yielding approximately 2.3%—and the ongoing share buyback program establish a firm floor under the equity valuation, rewarding patient capital with tangible cash returns while waiting for capital appreciation.
However, the valuation must be reconciled with the acute margin compression revealed in the first quarter of 2026 and benchmarked against industry peers. For context, PT Cisarua Mountain Dairy Tbk ($CMRY), a major competitor in the premium dairy and yogurt space, operates with structurally superior gross margins exceeding 40% and net profit margins hovering near 18.9%, commanding significantly higher valuation premiums. The collapse of gross margins to 26.2% indicates that reliance on commoditized block cheese and imported milk powders limits pricing power relative to premium liquid dairy peers.
If the structural increase in global milk powder prices proves permanent, and compensatory retail price increases through the SNS distribution network cannot be executed, baseline earnings power will degrade, rendering the 17.5x multiple significantly more expensive on a forward-looking basis. The market appears to be pricing the stock under the assumption that the Q1 2026 margin squeeze is a transitory phenomenon and that profitability will mean-revert to historical averages of roughly 30%.
The ultimate variable in the valuation equation is the terminal value expansion generated by the new Sumedang manufacturing facility and the strategic integration of Bel S.A. The market may not be fully appreciating the long-term cash flow implications of these catalysts. The Sumedang facility will effectively double production capacity, providing the operational leverage required to serve the growing demographic base over the next decade. Simultaneously, Bel S.A.’s active involvement promises to inject premium product lines and superior manufacturing efficiencies into the ecosystem. If expertise is successfully leveraged to transition the portfolio mix toward higher-margin snacking cheeses, the current reliance on commodity-sensitive block cheese will diminish, leading to structurally higher and more resilient profit margins. In this scenario, the current valuation represents a highly attractive entry point into a multi-year compounding growth story. Conversely, if the ramp-up of the Sumedang facility is plagued by execution delays or higher-than-anticipated startup costs, the resulting depreciation burden will flow heavily through the income statement just as raw material margins are already under pressure, potentially leading to a period of earnings stagnation.
Strategic Investment and Reasoned Judgment
PT Mulia Boga Raya Tbk presents a classic investment paradox: a structurally superior business model navigating a violently compressed operating environment. The financial disclosures for the first quarter of 2026 confirm beyond doubt that a highly cash-generative, capital-efficient compounder remains intact. The ability to grow top-line revenue by 28.9%, generate operating cash flow at double the rate of net income, and completely self-fund a massive Rp 691 billion factory expansion without issuing a single Rupiah of debt speaks to management executing at the highest echelons of financial discipline. The pristine balance sheet and deep integration into the Garudafood distribution network construct an economic moat that is virtually impenetrable to new, undercapitalized entrants.
However, the severe degradation of the gross margin from 32.5% to 26.2% is the defining empirical reality of the quarter. It reveals an enterprise that, despite its domestic market dominance, lacks immediate pricing elasticity to shield itself from global commodity shocks. Reliance on extreme operating expense containment—specifically the slashing of professional fees—to manufacture flat earnings is a tactical victory but a strategic warning sign. Furthermore, extreme customer concentration, with over 80% of sales routed through a single affiliated distributor, limits autonomous commercial leverage and creates exposure to intra-group policy shifts.
Therefore, the investment perspective must be framed as a conditional, high-conviction opportunity intrinsically dependent on the time horizon. For short-term capital focused on quarter-over-quarter earnings momentum, caution is warranted. The combination of sustained raw material inflation, the impending depreciation burden of the new Sumedang facility coming online in July 2026, and the lingering binary risk of the Rp 43.3 billion tax dispute suggests that the next several quarters may feature noisy, compressed earnings profiles.
Conversely, for institutional capital possessing a multi-year time horizon, an exceptionally rare asset is presented. The core thesis relies not on immediate margin expansion, but on structural transformation. The alliance with Bel S.A. provides the technological catalyst to premiumize the product portfolio, while the Sumedang expansion secures the volume capacity to satisfy a market where per capita cheese consumption is mathematically destined to multiply. Trading at approximately 17.5x earnings with a fully unlevered balance sheet, an aggressive 50% dividend payout policy, and a proven ability to generate immense free cash flow during normal operating environments, a premium valuation in the public markets is fundamentally justified. Current margin pressures, while acute, are fundamentally cyclical and tied to global commodity swings, whereas the demographic tailwinds and strategic partnerships are permanently structural. Consequently, the enterprise stands as a premier vehicle for capturing the long-term secular growth of the Indonesian consumer dairy market, provided there is a willingness to absorb short-term profitability friction in exchange for long-term compounding value.
Disclaimer
aluna Analytics is an independent research collective that operates without affiliation to any financial institution, broker, or advisory firm. We do not hold licenses as a securities dealer, investment advisor, or portfolio manager.
All materials published by aluna Analytics are created solely for informational and educational purposes. They reflect independent analytical interpretation and should not be regarded as personalized investment advice, solicitation, or endorsement of any security or strategy.
Market data, opinions, and projections presented herein are subject to change and may not predict future results. Readers remain fully responsible for any financial decisions made based on the information provided. We strongly encourage conducting personal due diligence and consulting a licensed professional before making investment commitments.
aluna Analytics is not regulated by the Financial Services Authority of Indonesia (OJK) and does not offer investment management or brokerage services. All content is presented in good faith, aiming to foster research literacy and informed market perspectives.


