

Author: aluna Analytics | Date: 29 April 2026 | Category: Market Intelligence
PT Astra International Tbk ($ASII) continues to function as a systemic pillar of the Indonesian macroeconomic landscape, operating an expansive conglomerate structure that commands dominant market shares across automotive manufacturing, financial services, heavy machinery, mining, agribusiness, and critical infrastructure. The consolidated financial data and corresponding market intelligence up to 29 April 2026 depict an enterprise navigating a profoundly complex operational crosscurrent. The company is currently managing acute, localized cyclical headwinds within its commodity-linked divisions while simultaneously demonstrating formidable structural resilience within its primary consumer-facing franchises.
Line chart of Astra International Tbk (ASII) with timeframe 1 Year.
For the first quarter ended 31 March 2026, Astra reported consolidated net revenue of Rp 78.67 trillion, representing a 5.6% contraction compared to the corresponding period in 2025. Correspondingly, net income attributable to owners of the parent declined by 15.6% to Rp 5.85 trillion, compressing basic earnings per share from Rp 171 to Rp 146. A superficial interpretation of this top-line and bottom-line degradation would erroneously suggest a broad-based structural deterioration of the conglomerate’s economic moat. However, a rigorous decomposition of the financial statements reveals that the earnings decline is almost entirely isolated within the Heavy Equipment, Mining, Construction, and Energy (HEMCE) segment. This division suffered a severe 79.1% profit contraction, catalyzed by a confluence of depressed thermal coal prices, extreme weather disruptions, regulatory suspensions at the highly profitable Martabe gold mine, and substantial non-recurring impairment charges related to nickel processing and geothermal assets.
Conversely, the conglomerate’s core compounding engines—the Automotive and Mobility segment and the Financial Services segment—delivered robust net income expansions of 4.2% and 5.8%, respectively, despite flat revenue growth and intense competitive disruptions from imported electric vehicles. This stark divergence highlights the fundamental architecture of Astra’s business model: a highly stable, cash-generative consumer ecosystem providing the financial density to absorb the extreme volatility inherent in its capital-intensive resource extraction operations.
From a capital allocation standpoint, the first quarter of 2026 represents a critical inflection point in corporate governance posture. The holding company, operating in tandem with its primary heavy-equipment subsidiary PT United Tractors Tbk ($UNTR), has aggressively accelerated shareholder return mechanisms to exploit persistent market dislocations. Astra executed Rp 2.7 trillion in parent-level share buybacks between November 2025 and March 2026, while United Tractors repurchased Rp 3.0 trillion of its own equity. This active treasury management is being executed against a backdrop of a deeply depressed valuation multiple, with the enterprise trading at a trailing price-to-earnings ratio oscillating near 7.6x to 8.2x, alongside an annualized dividend yield exceeding 6.3%.
Given the structural durability of the automotive ecosystem, the pristine credit quality underpinning the financial services division, and the impending operational normalization of the gold mining unit following the lifting of regulatory suspensions, the current market pricing implies an excessively punitive holding company discount. The underlying financial evidence suggests that the enterprise represents a high-conviction opportunity for institutional capital seeking robust free cash flow generation, deeply entrenched competitive positioning, and a management team increasingly focused on minority shareholder value creation.
Macroeconomic Context and Industry Operating Environment
The operational performance of Astra International is inextricably linked to the broader Indonesian macroeconomic environment, as the conglomerate’s diverse revenue streams effectively act as a proxy for the nation’s gross domestic product and domestic consumption health. In the first quarter of 2026, the Indonesian economy maintained a trajectory of robust expansion. Government and central bank projections indicate a first-quarter GDP expansion of approximately 5.5%, accelerating from the 5.39% growth recorded in the final quarter of 2025 and the 5.11% annualized growth achieved throughout 2025. This macroeconomic stability is structurally underpinned by domestic consumption, which accounts for roughly 54% of the national GDP, thereby providing a resilient foundation for retail automotive and consumer lending operations.
Monetary policy remains a critical stabilizing variable for the conglomerate. Bank Indonesia has maintained a disciplined and accommodative stance, holding its benchmark lending facility rate steady at 5.50% and its overnight deposit facility rate at 3.75% throughout the quarter. This stable interest rate environment, carefully calibrated to defend the Rupiah against external geopolitical shocks and global capital flight, has successfully anchored domestic price levels. As of March 2026, the annual inflation rate decelerated to a three-month low of 3.48%, comfortably within the central bank’s target corridor of 1.5% to 3.5%. For the financial services division, the cessation of aggressive rate-hiking cycles is highly advantageous, as it stabilizes the wholesale cost of funds while preserving lucrative net interest margins on the division’s fixed-rate consumer lending portfolio.
Despite the favorable macroeconomic backdrop, industry-specific data presents a highly complex and fragmented operating environment. Within the automotive sector, national wholesale volumes for March 2026 experienced a sharp contraction of 13.8% year-over-year, dropping to 61,271 units. This monthly deceleration was primarily distorted by the timing of the long Eid al-Fitr holiday, which significantly reduced effective working days and logistical throughput. Smoothing out this monthly volatility, the cumulative first-quarter national car sales recorded a modest 1.7% increase compared to the same period in 2025, reaching 209,021 units.
The Association of Indonesian Automotive Industries (Gaikindo) maintains a full-year 2026 domestic sales target of 850,000 units, reflecting a projected 5.8% recovery from the severely depressed 2025 baseline of 803,687 units. However, the competitive landscape is undergoing a violent structural transformation. The rapid penetration of battery electric vehicles (BEVs), spearheaded by aggressive pricing strategies from Chinese manufacturers such as BYD, is rapidly eroding the historical dominance of incumbent Japanese original equipment manufacturers (OEMs). During the first quarter, the EV segment expanded by 20.7%, capturing over 10.6% of the total market, forcing traditional market leaders to rapidly recalibrate their product pipelines and margin expectations.
The commodity markets, which dictate the profitability of the HEMCE and Agribusiness segments, exhibited extreme bifurcation during the quarter. Thermal coal prices, tracking the Indonesian benchmark (Harga Batubara Acuan or HBA), remained suppressed relative to the super-cycle peaks of 2022 and 2023. While the HBA for 6,322 GAR coal saw a slight uptick to USD 103.30 per ton in early 2026, it remains significantly below historical highs due to persistent global oversupply and aggressive domestic production increases in China. To proactively stabilize prices, the Indonesian Ministry of Energy and Mineral Resources mandated aggressive production cuts, reducing the 2026 national coal output target to 600 million tonnes from the nearly 790 million tonnes realized in 2025.
Conversely, the nickel market experienced acute supply-side shocks. Stringent Indonesian mining quota constraints and delays in work plan approvals sparked a 30% rally in global nickel prices in early 2026, pushing the metal beyond USD 17,000 per tonne before stabilizing. Gold, acting as a geopolitical safe haven amidst escalating Middle Eastern conflicts, traded at elevated levels, offering a highly lucrative margin profile for producers unencumbered by regulatory constraints. In the agricultural sector, crude palm oil (CPO) prices face ongoing volatility. While Indonesian production is projected to recover in 2026, the sector is currently navigating severe uncertainties regarding land title policies and state-backed land-seizure programs, which place millions of hectares of planted area at risk and threaten to disrupt supply chains.
Accounting Framework and Quality of Earnings Principles
To accurately interpret the financial condition, it is imperative to understand the rigorous accounting policies and estimation frameworks that govern the preparation of the consolidated financial statements. The financial statements for the period ended 31 March 2026 are prepared in strict accordance with Indonesian Financial Accounting Standards (SAK), utilizing the historical cost concept, modified for specific financial instruments and investment properties measured at fair value.
The recognition of revenue strictly adheres to a five-step analytical model, ensuring that top-line figures accurately reflect the transfer of economic control. Revenue from the sale of goods (automotive units, heavy equipment, agribusiness products) is recognized precisely when control of the asset is transferred to the customer. Revenue from consumer financing and finance leases is recognized over the term of the respective contracts utilizing the effective interest method, ensuring that interest income is matched proportionately to the outstanding principal balance. Furthermore, revenue from construction services, predominantly executed through the subsidiary PT Acset Indonusa Tbk, is recognized using the percentage-of-completion method based on verified physical progress, preventing the premature recognition of unearned profits.
The evaluation of asset quality, particularly within the massive financial services portfolio, is governed by a stringent Expected Credit Loss (ECL) model. The group measures the provision for impairment using a forward-looking three-stage approach. Receivables are categorized as “Performing” (Stage 1) upon origination. If a receivable becomes past due for 30 days or exhibits other signs of heightened risk, it is downgraded to “Underperforming” (Stage 2). Receivables past due for more than 90 days, or those where objective evidence indicates the debtor is unlikely to pay, are downgraded to “Non-performing” (Stage 3). This continuous monitoring ensures that the carrying value of the Rp 99.62 trillion financing portfolio accurately reflects true economic recoverability, preventing the accumulation of unrecognized toxic assets on the balance sheet.
Inventory valuation further demonstrates accounting conservatism. Inventories are stated at the lower of cost or net realizable value. The cost is generally determined using the weighted average method for finished goods and spare parts, while specific identification methods are utilized for high-value heavy equipment units and real estate inventory. This methodology ensures that any cyclical degradation in market pricing for commodities or heavy machinery immediately triggers inventory write-downs, flowing through the income statement and protecting future margins from overvalued historical costs.
In the realm of long-lived assets, the depreciation of mining properties and the amortization of toll road concession rights are calculated using the units-of-production method. This is a critical accounting policy; it ensures that depreciation expenses scale dynamically with actual extraction volumes or traffic throughput, rather than functioning as a rigid straight-line penalty during periods of low operational activity. Changes in estimated mineable reserves or traffic volume projections are accounted for prospectively, requiring management to continuously reassess the economic viability of the underlying assets.
Finally, the group has proactively integrated the implications of the new Pillar Two global minimum tax rules. The Minister of Finance Regulation No. PMK-136 Year 2024 came into effect on 1 January 2025, aligning Indonesia with the OECD framework. Management has conducted an extensive assessment of potential exposures, concluding that because the vast majority of its entities operate in jurisdictions with effective tax rates substantially above the 15% minimum threshold, the new regulations will not exert a material impact on consolidated income tax expenses.
Consolidated Income Statement and Profitability Dynamics
The consolidated income statement for the first quarter of 2026 depicts an enterprise facing significant revenue contraction while aggressively attempting to defend its gross margin profile against structural cost inflation. The absolute decline in net income is substantial, but a granular analysis reveals a high degree of earnings quality persisting beneath the headline deterioration.
| Consolidated Income Statement Summary | Q1 2026 (Rp Billions) | Q1 2025 (Rp Billions) | Change (%) |
|---|---|---|---|
| Net Revenue | 78,668 | 83,361 | (5.6%) |
| Cost of Revenue | (63,174) | (66,301) | (4.7%) |
| Gross Profit | 15,494 | 17,060 | (9.2%) |
| Selling Expenses | (3,167) | (2,967) | +6.7% |
| General & Administrative Expenses | (6,017) | (4,875) | +23.4% |
| Interest Income | 828 | 856 | (3.3%) |
| Finance Costs | (923) | (921) | +0.2% |
| Foreign Exchange Losses, net | (29) | (271) | (89.3%) |
| Share of Results of JVs & Associates | 1,902 | 1,779 | +6.9% |
| Profit Before Income Tax | 8,069 | 10,646 | (24.2%) |
| Income Tax Expenses | (1,646) | (2,091) | (21.3%) |
| Profit for the Period | 6,423 | 8,555 | (24.9%) |
| Profit Attributable to Owners of the Parent | 5,850 | 6,932 | (15.6%) |
Consolidated net revenue contracted by 5.6% year-over-year to Rp 78.67 trillion. This top-line erosion was driven entirely by the Heavy Equipment, Mining, Construction, and Energy (HEMCE) segment, which saw its revenues plummet due to lower thermal coal realization prices and severely restricted gold sales volumes. The cost of revenue declined at a slightly slower pace of 4.7% to Rp 63.17 trillion, resulting in a gross profit contraction of 9.2% to Rp 15.49 trillion. The gross margin compressed slightly from 20.5% in Q1 2025 to 19.7% in Q1 2026, primarily reflecting the loss of high-margin gold sales which previously elevated the blended corporate average.
Operational deleveraging became acutely evident below the gross profit line. Selling expenses increased by 6.7% to Rp 3.17 trillion, suggesting that the automotive division was required to deploy elevated marketing spend and dealer incentives to defend market share against aggressive new entrants. More concerningly, general and administrative (G&A) expenses surged by an immense 23.4% to Rp 6.02 trillion. This structural increase in the fixed cost base, occurring simultaneously with a contraction in revenue, significantly impaired operating margins. A detailed review of expenses by nature reveals that employee benefit expenses rose to Rp 7.05 trillion from Rp 6.89 trillion, while professional fees and IT infrastructure costs also saw upward pressure.
A critical component of the profitability architecture resides off-balance-sheet, captured through equity accounting. The “Share of results of joint ventures and associates” line item contributed Rp 1.90 trillion to the pre-tax profit, representing a 6.9% increase from Rp 1.78 trillion in the prior year. This growth is exceptionally important for assessing business quality; it indicates that the core automotive manufacturing joint ventures (PT Astra Honda Motor and PT Astra Daihatsu Motor), which are not consolidated on the top line, experienced sustained margin expansion and pricing power. This equity income effectively acts as an earnings shock absorber, buffering the consolidated bottom line against the extreme cyclicality of the fully consolidated heavy equipment divisions.
Net finance costs remained remarkably stable at Rp 923 billion, compared to Rp 921 billion in the prior year, despite the significant increase in overall corporate debt levels required to fund acquisitions. This stability is a direct result of meticulous interest rate hedging and the optimization of funding sources across the conglomerate’s various operating companies. Furthermore, foreign exchange losses were drastically reduced to a mere Rp 29 billion from Rp 271 billion in Q1 2025, validating the effectiveness of the treasury department’s cross-currency swap portfolio in neutralizing external currency volatility.
The reported 15.6% decline in net income attributable to owners of the parent (Rp 5.85 trillion) must be rigorously bifurcated into structural operational performance and temporary non-recurring factors. The reported basic earnings per share printed at Rp 146. However, this figure is heavily distorted by significant one-off events within the United Tractors subsidiary. Specifically, the HEMCE division recorded an equity-accounted net loss and impairment charge of Rp 723 billion related to older Rotary Kiln Electric Furnace (RKEF) nickel processing plants held through its associate, Nickel Industries Limited, alongside further adjustments in geothermal assets. When adjusting for these non-recurring fair value impairments and charges, the normalized net income decline was a much milder 8%, generating an adjusted core EPS of Rp 170. This distinction is paramount for equity valuation: the core cash-generating capacity of the conglomerate eroded by mid-single digits, not double digits, implying that headline valuation multiples significantly overstate the fundamental economic deterioration of the enterprise.
Cash Flow Dynamics and Capital Allocation
The analysis of cash flow dynamics provides vital context regarding the quality of the reported earnings and the aggressive evolution of the capital allocation strategy. The first quarter of 2026 witnessed a severe deceleration in cash conversion, which was immediately deployed into expansive M&A activity and shareholder return programs.
| Consolidated Cash Flow Summary | Q1 2026 (Rp Billions) | Q1 2025 (Rp Billions) |
|---|---|---|
| Cash receipts from customers | 78,519 | 79,389 |
| Cash payments to suppliers | (59,261) | (54,966) |
| Cash payments to employees | (6,829) | (6,643) |
| Corporate income tax paid | (2,406) | (2,829) |
| Net Cash Provided by Operating Activities | 6,274 | 13,381 |
| Acquisition of subsidiaries (net of cash acquired) | (8,731) | (1,014) |
| Additions to fixed assets | (2,401) | (4,047) |
| Additions to other investments (insurance) | (1,591) | (1,553) |
| Net Cash Used in Investing Activities | (12,560) | (6,911) |
| Proceeds from short-term borrowings | 78,534 | 71,202 |
| Repayments of short-term borrowings | (75,987) | (66,459) |
| Proceeds from long-term debt | 17,912 | 9,067 |
| Repayments of long-term debt | (14,430) | (11,084) |
| Purchase of treasury shares (Parent & Subsidiary) | (2,342) | 0 |
| Net Cash Provided by Financing Activities | 2,633 | 1,811 |
| Net (Decrease)/Increase in Cash and Cash Equivalents | (3,653) | 8,281 |
Net cash flows provided by operating activities plummeted to Rp 6.27 trillion from Rp 13.38 trillion in the first quarter of 2025. This sharp 53% deceleration in cash conversion was only partially driven by the decline in net income. The primary catalyst for the operating cash flow shortfall was a massive acceleration in cash payments to suppliers, which surged to Rp 59.26 trillion from Rp 54.97 trillion. This represents significant working capital consumption, likely related to the settlement of elevated trade payables accumulated at the end of the previous fiscal year, combined with strategic inventory procurement in anticipation of the post-holiday automotive sales recovery. Despite the severity of this drop, the absolute level of operating cash flow remained robust enough to comfortably cover the Rp 2.40 trillion in routine maintenance capital expenditure (additions to fixed assets).
The shortfall in operating cash flow generation necessitated the aggressive deployment of balance sheet cash to fund a massive expansion in investing activities. Net cash used in investing activities nearly doubled to Rp 12.56 trillion. This outflow was dominated by the Rp 8.73 trillion allocation for the acquisition of subsidiaries. The most prominent of these strategic deployments was the completion of the 100% acquisition of Arafura Surya Alam, a highly prospective gold mining asset located in North Sulawesi, executed through the United Tractors subsidiary. This transaction perfectly illustrates the capital rotation strategy: exchanging low-yielding fiat liquidity for high-return, long-duration mineral reserves that act as a natural hedge against fiat depreciation.
Financing cash flows were characterized by the aggressive utilization of debt markets to fund unprecedented shareholder return programs. Net cash provided by financing activities totaled Rp 2.63 trillion, driven by a massive Rp 17.91 trillion in proceeds from long-term debt, which vastly outpaced the Rp 14.43 trillion in long-term debt repayments. These debt proceeds were directly channeled into equity repurchases. During the quarter, parent-level treasury share purchases totaling Rp 989 billion were executed, while subsidiaries executed repurchases totaling Rp 1.35 trillion.
This aggressive buyback activity—amounting to Rp 2.7 trillion in total for Astra and Rp 3.0 trillion for United Tractors since the programs were initiated in late 2025 represents a paradigm shift in corporate governance. By leveraging the balance sheet to retire undervalued equity, management is signaling definitive confidence in the intrinsic value of the enterprise, fundamentally altering the historical narrative that the conglomerate inefficiently hoards surplus cash.
Balance Sheet Quality and Capital Structure
The balance sheet is characterized by immense scale, deep institutional liquidity, and a highly conservative capitalization philosophy that is carefully bifurcated between its corporate operations and its financial services arm. As of 31 March 2026, consolidated total assets reached Rp 517.80 trillion, expanding steadily from Rp 507.37 trillion at the close of 2025.
| Consolidated Balance Sheet Summary | 31 March 2026 (Rp Billions) | 31 December 2025 (Rp Billions) |
|---|---|---|
| Cash and cash equivalents | 49,046 | 52,621 |
| Trade receivables (Net) | 27,119 | 27,900 |
| Financing receivables (Net) | 99,616 | 96,698 |
| Inventories (Net) | 39,137 | 42,506 |
| Investments in joint ventures and associates | 70,551 | 73,441 |
| Fixed assets (Net) | 84,388 | 83,766 |
| Mining properties (Net) | 21,846 | 14,809 |
| Total Assets | 517,804 | 507,366 |
| Short-term borrowings | 23,647 | 21,001 |
| Trade payables | 35,140 | 39,238 |
| Long-term debt (including current portion) | 68,306 | 63,827 |
| Debt securities (including current portion) | 22,996 | 23,513 |
| Total Liabilities | 224,681 | 216,554 |
| Total Equity | 293,123 | 290,812 |
The asset base is heavily weighted toward high-velocity current assets, which stood at Rp 188.49 trillion, providing immense operational flexibility and protection against short-term liquidity shocks. Cash and cash equivalents contracted to Rp 49.05 trillion from Rp 52.62 trillion in the preceding quarter, a deliberate drawdown reflecting the aggressive capital deployment into the Arafura Surya Alam acquisition and the share buyback programs.
The largest single asset class on the balance sheet is the financing receivables portfolio, which grew to Rp 99.62 trillion from Rp 96.70 trillion at year-end. Asset quality across this massive lending portfolio remains pristine. The provision for impairment on financing receivables increased only marginally to Rp 5.52 trillion from Rp 5.44 trillion. This microscopic 1.4% increase in the provision against a 3% increase in the gross loan book indicates that non-performing loan (NPL) formation is being tightly controlled, validating the stringent underwriting standards and the efficacy of the three-stage Expected Credit Loss (ECL) model employed by the financial services division.
Inventories decreased to Rp 39.14 trillion from Rp 42.51 trillion. This inventory drawdown, particularly evident in the automotive and heavy equipment divisions, is a highly positive indicator. It demonstrates disciplined supply chain management and an agile response to the softening end-market demand, thereby avoiding the margin-crushing destocking cycles and obsolescence write-downs that frequently plague cyclical manufacturing businesses.
To accurately assess the structural quality of the leverage, it is essential to disaggregate the financial services operations from the core corporate operations. The financial services segment inherently requires elevated leverage to generate a viable return on equity. As of 31 March 2026, the financial services division carried a net debt position of Rp 65.98 trillion, which is perfectly matched against and fully collateralized by its performing financing receivables portfolio of Rp 99.62 trillion.
Excluding the financial services division, the core corporate operations transitioned from a net cash position of Rp 7.2 trillion at the end of 2025 to a modest net debt position of Rp 1.81 trillion by the end of Q1 2026. This shift confirms the aggressive deployment of surplus capital into value-accretive M&A and treasury share repurchases. Despite this deliberate leveraging, the consolidated gearing ratio—calculated as total net debt divided by total equity—remains exceptionally conservative at just 23%. This pristine capitalization provides the ultimate strategic optionality: the capacity to execute transformative acquisitions or weather prolonged macroeconomic downturns without the threat of balance sheet impairment.
Financial Risk Management and Hedging Architecture
Treasury operations execute a highly sophisticated financial risk management framework designed to insulate cash flows from the extreme volatility inherent in emerging market currencies and interest rates. The group is systematically exposed to foreign exchange risk (due to imported heavy machinery and automotive components) and interest rate risk (due to the massive funding requirements of its financial services division).
| Outstanding Debt Securities (Select Tranches) | Principal (Rp Billions) | Maturity | Interest Rate | Rating |
|---|---|---|---|---|
| Astra Sedaya Finance – Bond VI Ph I | 1,973 | July 2026 | 6.00% | AAA(id) |
| Astra Sedaya Finance – Bond VI Ph IV | 1,416 | Oct 2027 | 6.70% | AAA(id) |
| Federal International Finance – Bond VII Ph II | 2,500 | 2026-2028 | 5.85%-6.15% | idAAA |
| SAN Finance – Bond V Ph II | 1,200 | 2027-2031 | 4.75%-5.80% | idAA+ |
The foundation of the liability structure rests on the issuance of high-grade domestic corporate bonds. Entities such as PT Astra Sedaya Finance and PT Federal International Finance routinely issue “Obligasi Berkelanjutan” (Continuous Bonds) securing AAA(id) and idAAA ratings from Fitch and Pefindo, respectively. These pristine credit ratings allow the financial services division to access domestic capital markets at incredibly compressed spreads. For instance, the Astra Sedaya Finance Bond VI Phase I carries a fixed coupon of just 6.00%, securing low-cost, long-duration funding that is then lent out to consumers at significantly higher yields.
To manage the Rp 51.24 trillion of floating-rate borrowings, the treasury department aggressively utilizes derivative financial instruments. The group strictly prohibits speculative trading, utilizing derivatives purely for cash flow hedging. As of 31 March 2026, the company held a massive portfolio of cross-currency swaps with a notional value of USD 775.25 million, effectively locking in the Rupiah exchange rate on its foreign-denominated liabilities and neutralizing translation risk. Furthermore, the company held forward foreign exchange contracts with a notional value of USD 74.69 million to hedge near-term import payables.
In response to the global cessation of the JIBOR (Jakarta Interbank Offered Rate) benchmark after December 2025, the treasury successfully negotiated the transition of its massive floating-rate syndicated loan portfolio. By 31 March 2026, the group had transitioned its primary Rupiah-denominated syndicated facilities (led by PT Bank Central Asia Tbk ($BBCA) and PT Bank Mandiri Tbk ($BMRI)) to the Compounded IndONIA (Indonesia Overnight Index Average) benchmark, typically priced at IndONIA + 1.10% to 2.15%. Foreign currency syndicated loans, such as the USD 675 million facility agented by Oversea-Chinese Banking Corporation Ltd, were seamlessly transitioned to Term SOFR + 0.68% to 0.95%. This proactive benchmark transition eliminates legacy legal risks and ensures uninterrupted access to global wholesale funding markets.
Segmental Deep Dive: Automotive and Mobility
The Automotive and Mobility segment remains the undisputed crown jewel of the empire, operating as a high-quality compounder characterized by dominant market share, pricing power, and formidable barriers to entry. In Q1 2026, the segment generated net revenue of Rp 32.96 trillion, virtually flat compared to Rp 33.09 trillion in 2025. Remarkably, despite the top-line stagnation and the 13.8% monthly contraction in national wholesale volumes due to holiday effects, the segment expanded its net income by 4.2% to Rp 2.37 trillion.
| Segment Financial Performance | Net Revenue (Rp Billions) | Profit Before Tax (Rp Billions) | Net Income Attributable to Owners (Rp Billions) |
|---|---|---|---|
| Automotive and Mobility | 32,958 | 2,657 | 2,366 |
| Financial Services | 8,537 | 2,888 | 2,267 |
| HEMCE (Heavy Eq., Mining, Energy) | 28,554 | 1,321 | 408 |
| Agribusiness | 7,502 | 540 | 298 |
| Infrastructure | 641 | 461 | 343 |
| Information Technology | 760 | 87 | 53 |
| Property | 345 | 115 | 115 |
This margin expansion against a flat top-line is a profound testament to the segment’s pricing power and product mix optimization. The Indonesian automotive market is fiercely competitive, historically dominated by joint ventures: PT Toyota-Astra Motor and PT Astra Daihatsu Motor for four-wheelers (4W), and PT Astra Honda Motor for two-wheelers (2W). The market is currently undergoing a violent structural transformation with the aggressive entry of Chinese electric vehicle manufacturers, most notably BYD, which captured over 10% of the EV market share in the early months of 2026.
Despite this technological disruption, the ecosystem remains deeply entrenched. The actual financial performance of the core manufacturing operations is captured off-balance-sheet via equity accounting. As of 31 March 2026, PT Astra Honda Motor (AHM) boasted total assets of Rp 40.38 trillion and net assets of Rp 10.23 trillion, generating a highly lucrative dividend stream back to the parent. Similarly, PT Astra Daihatsu Motor (ADM) held net assets of Rp 14.75 trillion and generated Rp 897 million in total comprehensive income for the quarter, driven by the sustained dominance of models like the Gran Max PU in the commercial space.
Furthermore, an active pivot to capture the entire vehicle lifecycle value chain is defending this moat. The strategic partnership with Toyota Motor Asia in the used car platform PT Astra Digital Mobil (ADMO), housing the OLXmobbi brand, integrates secondary market liquidity into the primary sales funnel. By allowing Toyota to purchase a 40% stake in ADMO for USD 120 million (Rp 2.0 trillion), a digital asset was monetized at a premium valuation while solidifying OEM alignment. The automotive segment is clearly not a sunset industry; it is a highly defensive cash cow successfully utilizing its vast distribution network, scale economies, and aftermarket service infrastructure to outlast aggressive, margin-subsidized market entrants.
Segmental Deep Dive: Financial Services
Operating in symbiotic tandem with the automotive division, the Financial Services segment provides the captive financing velocity that accelerates vehicle sales while generating independent, high-return interest income. The segment reported net revenue of Rp 8.54 trillion (up 6.8% from Rp 8.00 trillion) and a net income expansion of 5.8% to Rp 2.27 trillion.
The underlying economics of this business are exceptionally robust. Gross consumer financing receivables grew to Rp 117.40 trillion (Astra’s portion), while finance lease receivables reached Rp 13.81 trillion. The gross yield on these portfolios is massive, providing an expansive net interest margin that easily absorbs credit losses and operational costs. The effective annual interest rates on new consumer financing in Rupiah originated during the quarter ranged from 7.0% to a staggering 44.7%, while finance leases yielded between 7.0% and 36.0%.
Risk management within the financial services division is managed via sophisticated financial engineering. The division heavily utilizes joint financing agreements with major banking institutions. Of the gross consumer financing portfolio, Rp 18.54 trillion is structured as joint financing, with Rp 15.25 trillion financed directly by third-party banks without recourse to the parent company. This structure shifts the credit risk to the banking sector, effectively utilizing off-balance-sheet leverage to drastically boost the return on equity while maintaining customer relationships and origination fees. The 5.8% bottom-line growth, achieved in an environment of stable benchmark rates and easing inflation, underscores the durability of the underwriting standards and the relentless efficiency of the collection infrastructure spanning PT Federal International Finance (FIF) and PT Astra Sedaya Finance (ACC).
Segmental Deep Dive: Heavy Equipment, Mining, Construction, and Energy (HEMCE)
The HEMCE segment, operated entirely through the 59.5%-owned publicly listed subsidiary PT United Tractors Tbk ($UNTR), was the sole catalyst for the consolidated earnings contraction. Net revenue fell 16.7% to Rp 28.55 trillion, while net income capitulated by 79.1% to a mere Rp 408 billion. This segment operates as a highly cyclical, capital-intensive entity violently exposed to global commodity volatility and regulatory interventions.
| PT United Tractors Tbk Operational Metrics | Q1 2026 | Q1 2025 | Change (%) |
|---|---|---|---|
| Komatsu Sales Volume (Units) | 1,385 | 1,126 | +23.0% |
| PAMA Overburden Removal (Million BCM) | 252 | 286 | (11.9%) |
| Coal Production for Clients (Million Tons) | 148 | 148 | Flat |
| Gold Sales Volume (Thousand Ounces) | ~1.0 (Jan) | ~16.6 (Jan) | (94.0%) |
The financial degradation in Q1 2026 was multipronged and severe:
- Mining Contracting (PAMA): PT Pamapersada Nusantara (PAMA) suffered a significant decline in overburden removal volume, dropping to 252 million bank cubic meters (bcm) for the quarter. This reduction in operational efficiency was driven by severe weather events (heavy rainfall flooding pits) and a strategic reduction in stripping ratios by coal concession owners responding to the depressed thermal coal pricing environment. This resulted in acute negative operating leverage, as fixed depreciation costs on the massive heavy equipment fleet outpaced contracting revenues.
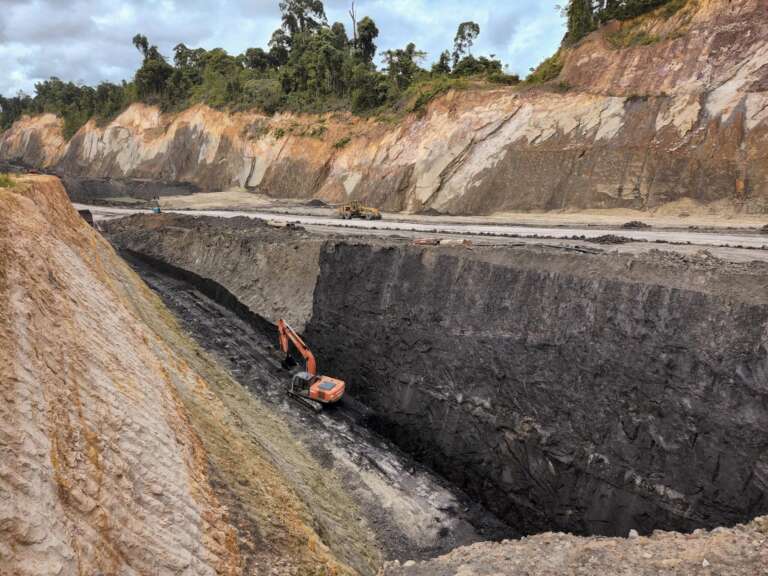
- Gold Mining Regulatory Halt: The most devastating shock was the regulatory suspension of the Martabe gold mine. Operated by Agincourt Resources, the mine faced severe environmental lawsuits seeking Rp 4.8 trillion following deadly regional floods. The Ministry of Environment and Forestry halted production activities on December 6, 2025. The suspension persisted through the majority of Q1 2026, causing gold sales volumes to plummet by 94% year-over-year in January. While operations finally resumed in March 2026 after securing regulatory approval, the lost production during a period of record-high global gold prices (exceeding USD 2,300/oz) represented a massive opportunity cost and profit void for the quarter.
- Non-Recurring Impairments: The reported net income was further decimated by a massive non-cash impairment. The segment recorded an equity-accounted net loss and impairment charge of Rp 723 billion related to older Rotary Kiln Electric Furnace (RKEF) nickel processing plants held through an associate, Nickel Industries Limited, alongside write-downs in geothermal assets.
Despite this disastrous quarter, the structural integrity of the HEMCE division’s core franchises remains intact. The heavy equipment distribution business actually expanded robustly, with Komatsu sales volumes rising 23% year-over-year to 1,385 units, maintaining a dominant 24% market share. The resumption of the Martabe mine, combined with the newly acquired Arafura Surya Alam gold asset, positions the segment for a violent earnings recovery in subsequent quarters. The Q1 2026 performance represents a cyclical trough exacerbated by idiosyncratic, non-recurring events rather than a terminal business decline.
Segmental Deep Dive: Agribusiness, Infrastructure, IT, and Property
These auxiliary segments, while contributing a smaller absolute proportion to consolidated earnings, demonstrated robust counter-cyclical growth, validating the long-term diversification strategy away from pure automotive and coal dependency.
- Agribusiness: Operated primarily through the 79.68%-owned subsidiary PT Astra Agro Lestari Tbk ($AALI), the segment capitalized on favorable Crude Palm Oil (CPO) pricing dynamics. Despite the existential threat of government land seizure programs affecting the broader industry, the division expanded net income by 34.8% to Rp 298 billion, up from Rp 221 billion.
- Infrastructure: Toll road operations, managed via PT Astra Tol Nusantara, continued to scale as traffic volumes normalized and expanded post-pandemic. The segment, which holds concession rights amortized via the units-of-production method, lifted net income by 31.9% to Rp 343 billion.
- Property: The property segment posted a remarkable 144.7% surge in net income, reaching Rp 115 billion. This structural shift in earnings capacity was catalyzed by the 2025 acquisition of a 91.43% stake in PT Mega Manunggal Property Tbk ($MMLP). This acquisition instantly provided a premier portfolio of industrial and logistics real estate, effectively transitioning the division from a lumpy, capital-intensive residential developer to a high-quality, recurring-yield commercial landlord.
Enterprise Valuation and Implied Attractiveness
Valuing a conglomerate of this magnitude requires a strict Sum-of-the-Parts (SOTP) framework, acknowledging the reality that public equity markets consistently apply a “holding company discount” to highly diversified entities. At the close of April 2026, equity traded at a trailing Price-to-Earnings (P/E) multiple of approximately 7.6x to 8.2x. This represents a steep discount to both its own historical averages and the broader Indonesian equity benchmarks.
This depressed valuation multiple suggests the market is erroneously extrapolating the Q1 2026 earnings decline—specifically the mining suspensions and heavy equipment weather disruptions—into perpetuity, while entirely ignoring the normalized earnings power of the enterprise. If the Rp 723 billion non-recurring nickel and geothermal impairment is added back to the bottom line, the core P/E multiple compresses even further, revealing a deeply undervalued cash-flow engine.


Crucially, the implied attractiveness of the equity is radically enhanced by the management’s aggressive pivot toward shareholder capital returns. Historically, Asian conglomerates that hoard cash in low-yielding deposits warrant deep structural discounts. However, the proactive deployment of a Rp 2.7 trillion parent-level share buyback program, combined with United Tractors’ Rp 3.0 trillion repurchase program, signals definitive intrinsic value support from the board of directors. By retiring shares at a 7.6x P/E, management is executing highly accretive financial engineering. Furthermore, the company declared a final dividend of Rp 292 per share, translating to a highly attractive annualized dividend yield in excess of 6.3%, fully covered by operating cash flow and fortified by the massive Rp 49.0 trillion cash balance.
Given the impenetrable defensive moat of the automotive division, the high return on equity of the financial services arm, and the inevitable cyclical upside embedded in the gold and coal operations, the current market pricing reflects a scenario of structural decline that the financial evidence definitively contradicts. The business justifies a significant premium valuation relative to its current discounted state, presenting a highly asymmetric risk-reward profile for institutional capital.
Structural Risks and Hidden Vulnerabilities
While the foundational economics are undeniably robust, the enterprise is exposed to several intersecting risk vectors that require continuous monitoring by allocators of capital.
- Operational Fragility and Regulatory Dependency in Mining: The severe suspension of the Martabe gold mine highlights an acute operational fragility: the absolute reliance on continuous regulatory goodwill in the extractive industries. Environmental lawsuits and government-mandated suspensions can instantaneously zero out cash flow from high-margin assets, regardless of global commodity prices. Furthermore, the Indonesian government’s rigid control over coal production quotas (RKAB) and Domestic Market Obligations (DMO) heavily restricts United Tractors’ ability to optimize output in response to seaborne price signals, capping upside while exposing the firm to downside price risk during periods of global oversupply.
- Technological Disruption and Margin Compression in Automotive: The rapid penetration of Chinese battery electric vehicles (BEVs) represents an existential, slow-moving threat to internal combustion engine (ICE) dominance. While Toyota and Honda possess immense brand equity, unparalleled distribution networks, and superior aftermarket service infrastructure, they have structurally trailed in affordable BEV product development. If the market share of aggressive entrants like BYD accelerates rapidly beyond the current 10% threshold, severe structural margin compression could follow. The conglomerate would be forced to heavily subsidize marketing and dealer incentives to defend its market position, fundamentally altering the high-return economics of the division.
- Financial Risk and Working Capital Distortions: The sharp 53% reduction in operating cash flow in Q1 2026 warrants rigorous scrutiny. While largely explained by timing differences in tax payments and the settlement of supplier payables accumulated late in 2025, any persistent degradation in cash conversion could constrain operational flexibility. A failure to generate sufficient operating cash would impair the ability to simultaneously fund the generous 6.3% dividend payout, the ambitious share buyback program, and the capital-intensive transition toward downstream mineral processing (such as the High-Pressure Acid Leach (HPAL) smelter investments via the newly formed Nusantara Industri Nikel Lestari). Additionally, while currently pristine, the financial services division carries Rp 65.98 trillion in net debt. A sudden macroeconomic shock that spikes domestic unemployment could trigger a rapid escalation in NPLs, breaching the profitability of the captive financing model.
Investment Perspective
The first-quarter 2026 financial statements depict a premier Southeast Asian conglomerate traversing a complex and optically severe cyclical trough. The reported 15.6% contraction in net income masks the profound underlying durability of the enterprise. The earnings drag is isolated, quantifiable, and largely non-recurring—stemming from a perfect storm of weather-related mining disruptions, a temporary regulatory halt at a highly profitable gold asset, and one-off impairment charges in the downstream resource portfolio.
Beneath this cyclical noise, the structural growth engines of the company—automotive distribution, captive financial services, and newly acquired logistics real estate assets—continue to compound intrinsic value with expanding margins and dominant market positioning.
Most importantly, the aggressive shift in corporate capital allocation—evidenced by nearly Rp 5.7 trillion in combined share buybacks across the parent and its heavy equipment subsidiary, alongside a sector-leading dividend yield—demonstrates a management team acutely aware of the disparity between the market’s punitive valuation and the firm’s true economic reality.
The enterprise does not represent a structurally challenged business; it is a high-quality compounder temporarily obscured by cyclical shadows. For the institutional investor, the current financial profile, fortified by deep liquidity, impeccable credit quality, and a highly proactive treasury strategy, presents a high-conviction opportunity. It possesses the financial architecture to easily absorb ongoing macroeconomic volatility while remaining fundamentally coiled for significant earnings acceleration upon the normalization of its extractive operations.
Disclaimer
aluna Analytics is an independent research collective that operates without affiliation to any financial institution, broker, or advisory firm. We do not hold licenses as a securities dealer, investment advisor, or portfolio manager.
All materials published by aluna Analytics are created solely for informational and educational purposes. They reflect independent analytical interpretation and should not be regarded as personalized investment advice, solicitation, or endorsement of any security or strategy.
Market data, opinions, and projections presented herein are subject to change and may not predict future results. Readers remain fully responsible for any financial decisions made based on the information provided. We strongly encourage conducting personal due diligence and consulting a licensed professional before making investment commitments.
aluna Analytics is not regulated by the Financial Services Authority of Indonesia (OJK) and does not offer investment management or brokerage services. All content is presented in good faith, aiming to foster research literacy and informed market perspectives.