
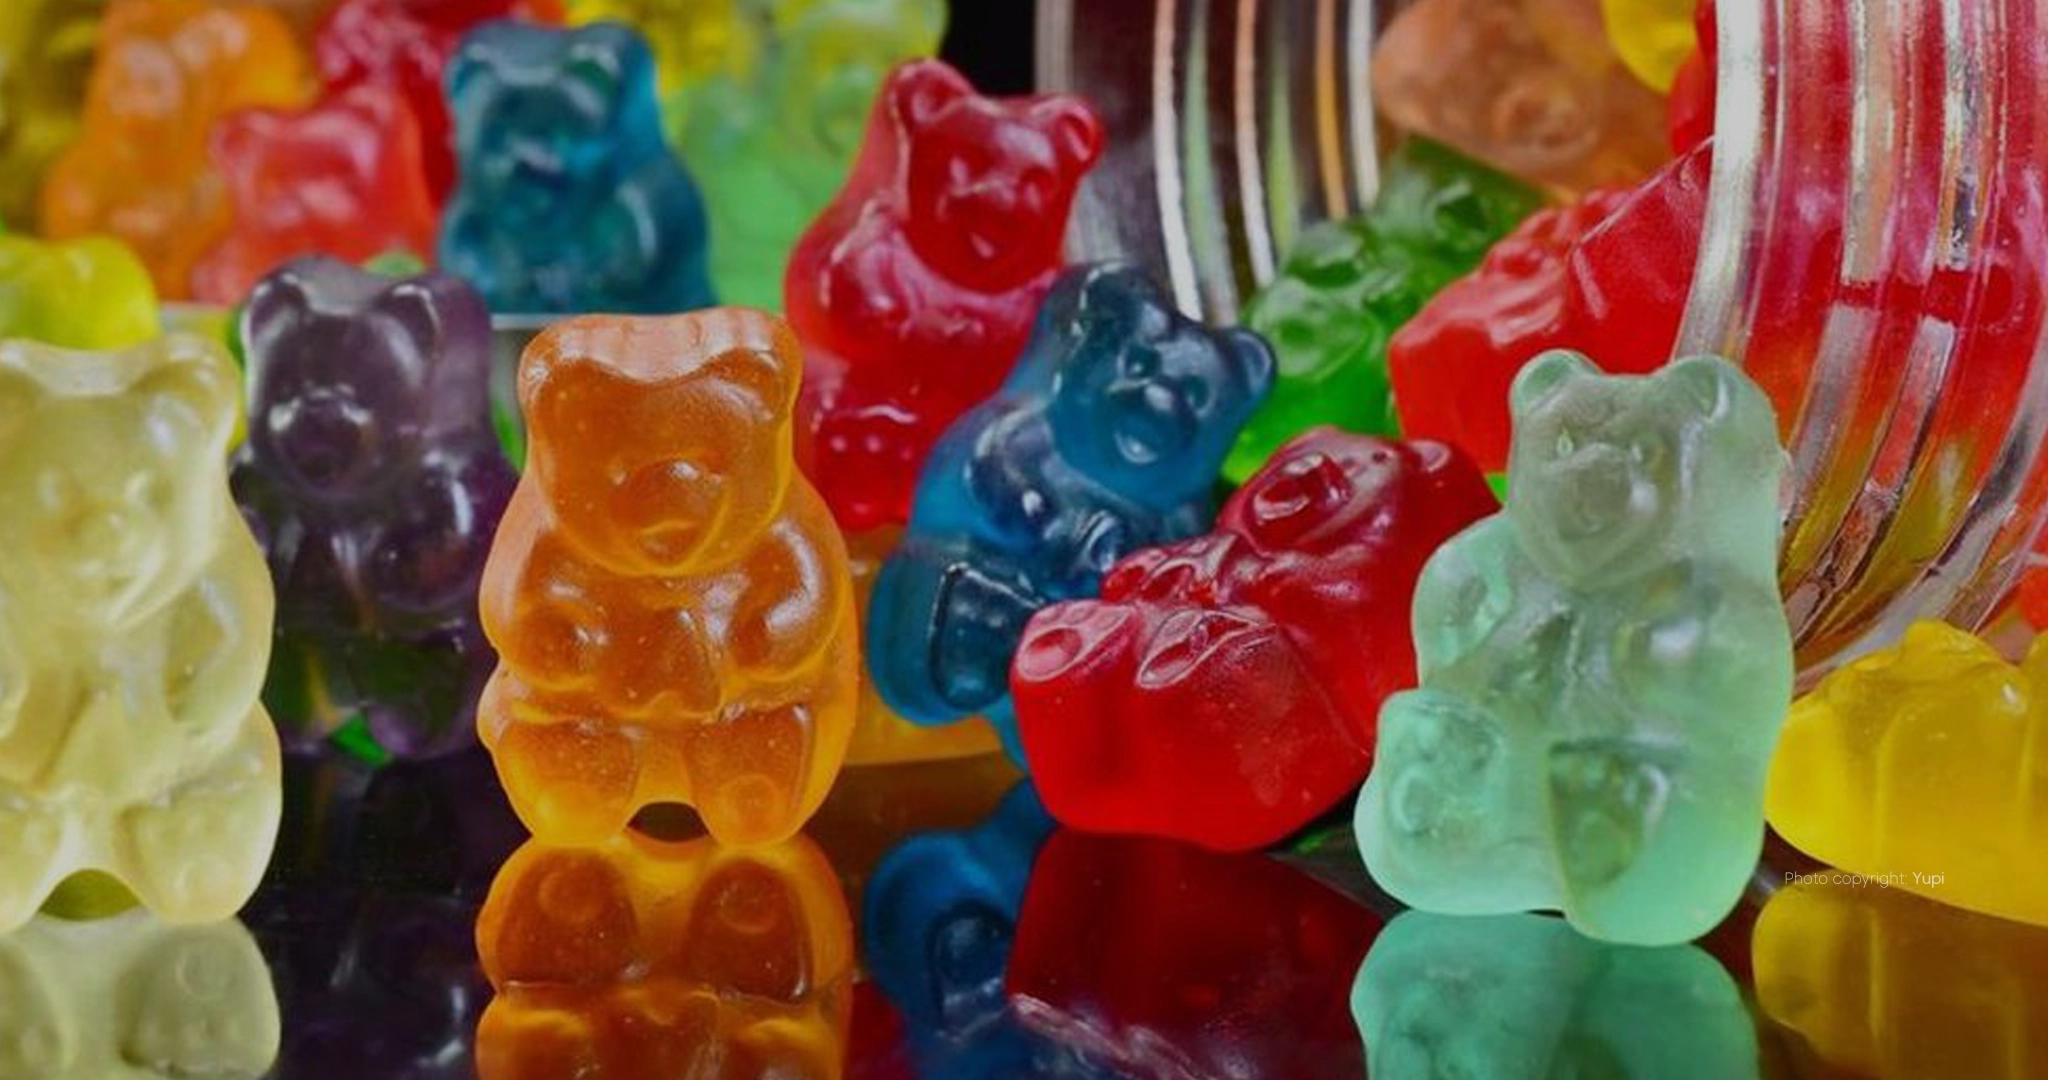



Author: aluna Analytics | Date: March 16, 2025 | Sector: Consumer Non-Cyclicals / Processed Foods | Recommendation: Beware (Fundamental) / Subscribe (Speculative)
The Initial Public Offering (IPO) of PT Yupi Indo Jelly Gum Tbk (“YUPI” or “the Company”) on the Indonesia Stock Exchange (IDX) represents a landmark transaction within the consumer non-cyclicals sector, specifically the processed foods sub-sector. As the dominant market leader in Indonesia’s soft candy and gummy confectionery industry with a reported 66.5% market share, $YUPI enters the public market with a robust fundamental profile characterized by double-digit net profit margins and zero-leverage balance sheet prior to expansion. However, the offering structure is heavily weighted towards shareholder exit rather than capital injection, creating a tension between business quality and deal mechanics.
The Company is offering a total of 854,448,900 ordinary shares, representing 10.00% of the enlarged paid-up capital post-IPO. The offering price range has been set at IDR 2,100 to IDR 2,500 per share, implying a total deal size between IDR 1.79 trillion and IDR 2.13 trillion. This valuation places the issuer at a significant premium to its listed peers, trading at a forward Price-to-Earnings (PER) ratio of approximately 27.8x at the lower end of the range, compared to industry stalwarts trading between 15x and 22x.
A critical strategic element of this IPO is the concurrent change in control. Following the listing, PT Confectionery Consumer Products Indonesia (CCPI) is slated to acquire a 90% controlling interest from the current shareholders, PT Sweets Indonesia and Daniel Budiman. This acquisition structure suggests that the IPO price may serve as a benchmark for the private transaction, potentially anchoring the valuation at a level beneficial to selling shareholders rather than incoming minority investors.
YUPI
PT Yupi Indo Jelly Gum TbkDisclaimer: This research report is produced by aluna Analytics for informational and educational purposes only. It does not constitute a recommendation to buy or sell any securities. Market data is analyzed as of March 16, 2025. Investors should conduct their own due diligence and consult with a certified financial advisor before making investment decisions.
While the business fundamentals are undeniably strong—evidenced by a net profit of IDR 484 billion in the first nine months of 2024 and consistent dividend capabilities—the aggressive pricing, the 70% divestment ratio in the offering structure, and the looming acquisition create a complex investment landscape. This analysis dissects the offering to determine whether the premium valuation is justified by the Company’s “moat” in the gummy segment or if it represents an over-optimized exit strategy for the founders.
Transaction Overview & Capital Structure Mechanics
The Offering Structure
The IPO of PT Yupi Indo Jelly Gum Tbk is governed by a structure that prioritizes shareholder exit liquidity over organic growth financing. The total offering of 854,448,900 shares is bifurcated into two distinct tranches, a detail critical for investors analyzing the flow of funds.
- Primary Offering (New Shares): The Company is issuing 256,334,700 new shares, representing approximately 30% of the total offering and 3.00% of the post-IPO enlarged capital. At the bookbuilding range of IDR 2,100 – IDR 2,500, this tranche will raise gross proceeds of roughly IDR 538 billion to IDR 640 billion for the Company. This capital injection is modest relative to the Company’s size and valuation, indicating that the primary motivation for the listing is not urgent capital need but rather a strategic liquidity event or corporate restructuring necessity.
- Secondary Offering (Divestment Shares): The majority of the offering consists of 598,114,200 existing shares, representing approximately 70% of the total offering and 7.00% of the post-IPO enlarged capital. These shares are being divested by the selling shareholder, PT Sweets Indonesia (PTSI). Proceeds from this tranche, estimated between IDR 1.25 trillion and IDR 1.49 trillion, will flow entirely to PT Sweets Indonesia and will not benefit YUPI’s balance sheet or operational capabilities.
aluna Analytics Insight: The dominance of the secondary tranche is a significant signal. In the context of IPO analysis, a high divestment ratio often suggests that insiders believe the valuation is full or that the capital markets offer a better exit price than private markets. Investors are effectively buying out existing owners rather than funding future growth to the same extent.
Key Dates and Mechanics
The IPO timeline is structured as follows:
- Bookbuilding Period: March 6 – March 10, 2025.
- Effective Statement: Expected March 14, 2025.
- Public Offering Period: March 19 – March 21, 2025.
- Allotment Date: March 21, 2025.
- Listing Date: March 25, 2025.
The offering utilizes the e-IPO system, mandating the availability of funds in the Customer Fund Account (RDN) prior to ordering, which reduces the incidence of phantom orders and provides a cleaner demand picture.
Warrants: There are no warrants attached to this offering. The absence of Series I Warrants is notable; often used as “sweeteners” to incentivize retail participation in riskier or smaller IPOs, their absence here implies underwriter confidence in the demand for YUPI shares based solely on fundamental quality.
MESOP/ESOP: The prospectus does not explicitly quantify an immediate Management Employee Stock Option Plan (MESOP) allocation concurrent with the IPO offering tranche. This reduces the risk of immediate overhang from employee liquidation in the secondary market post-listing.
Use of Proceeds: Analytical Breakdown
The net proceeds accruing to the Company (from the 30% new shares tranche) are allocated with a clear focus on capacity expansion, a necessary step given the high utilization rates implied by their market dominance.
1. Capital Expenditure (77%):
The majority of the funds are earmarked for the construction of a new production facility in Nganjuk, East Java. The total construction cost is estimated at IDR 437.5 billion, with operations targeted to commence in 2026. This expansion is critical as $YUPI currently operates factories in Gunung Putri and Karanganyar with a total capacity of approximately 93,000 tons per year. The Nganjuk facility not only increases volume capacity to meet domestic and export demand but also provides geographic diversification within Java, potentially optimizing logistics costs for distribution to eastern Indonesia.
2. Working Capital (23%):
The remaining proceeds will support operational expenditures, including business expansion (domestic and international), Term of Payment (TOP) financing for receivables, inventory procurement (specifically raw materials like sugar, glucose syrup, and gelatin), and workforce expansion. Given the Company’s strong operating cash flow (IDR 551 billion TTM as of Sep 2025), the allocation to working capital appears more as a buffer than a lifeline. The company is not cash-starved; rather, this liquidity likely supports the ramp-up phase of the new factory before it becomes cash-flow positive.
Corporate Profile & Business Model
Corporate History and Evolution
Established in 1996 as a joint venture, PT Yupi Indo Jelly Gum Tbk has evolved from a domestic manufacturer into a regional powerhouse. The company operates in the “sugar confectionery” industry, specifically dominating the “soft candy” or gummy sub-segment. Over nearly three decades, $YUPI has transitioned from a single-product company to a diversified confectionery player with a portfolio of 64 SKUs distributed across 45 countries.
Business Model and Competitive Moat
The Company’s business model is grounded in volume manufacturing and brand dominance. It operates as a B2C (Business to Consumer) entity with a massive distribution footprint, supplemented by a B2B (Business to Business) OEM arm.
- Gummy: The core revenue driver, including iconic shapes like “Gummy Burger,” “Gummy Pizza,” and “Neon Stix.” These products utilize gelatin-based technology that requires precise humidity and temperature control during manufacturing, creating a technical barrier to entry for smaller competitors.
- Bolicious: A strategic product line featuring fruit juice fillings, positioned to address health-conscious trends and appeal to a slightly older demographic than the traditional gummy bear consumer.
- Extruded Soft Candy & Marshmallows: Diversification products that utilize different production lines but leverage the same distribution network.
The “Yupi” Moat:
Commanding a staggering 66.5% market share in the Indonesian soft candy market creates a self-reinforcing competitive advantage. Producing over 93,000 tons annually allows the Company to procure sugar and gelatin at lower unit costs than competitors, contributing to its superior gross margins (32-34%). With high brand demand, it becomes a “must-have” SKU for retailers (minimarkets like Alfamart/Indomaret and traditional warungs), granting shelf-space priority and pricing power. In Indonesia, the brand has achieved genericized trademark status where “gummy candy” is often referred to simply as “Yupi” by consumers.
Customer Profile and Segmentation
Domestic Market: The primary revenue engine. The customer base spans all economic classes (A to D) due to affordable price points (sachets sold at IDR 1,000 – 2,000). The demographic is heavily skewed toward children (ages 4-12) and young adults (Gen Z).
Export Markets: YUPI exports to 45 countries, with strong footholds in Southeast Asia (Thailand, Vietnam, Malaysia), the Middle East, and North America. Exports provide a natural hedge against IDR currency fluctuations, as revenue is generated in USD while costs are mixed.
OEM Services: The company provides manufacturing services for nutraceutical gummies (e.g., vitamin gummies) and private labels, leveraging its idle capacity and technical expertise to generate high-margin B2B revenue.
Macroeconomic & Industry Context
Macroeconomic Variables
The performance of the Company is intrinsically linked to Indonesian consumer purchasing power and raw material commodity cycles. Despite global headwinds, Indonesia’s domestic consumption remains resilient. The Consumer Confidence Index (CCI) in early 2025 hovered between 121.1 and 127.2, well above the 100-point optimism threshold. This indicates that consumers remain willing to spend on discretionary items. Confectionery, being a low-ticket “affordable indulgence,” typically demonstrates resilience even during economic soft patches (the “Lipstick Effect”). With GDP growth projected at ~5.1% for 2025, the macro backdrop supports continued volume growth.
Regarding raw material sensitivity, sugar is a primary input cost, and its prices in Indonesia are regulated but influenced by global futures. Gelatin, crucial for gummy texture, is largely imported (from suppliers in Europe, USA, or China), exposing the Company to USD/IDR exchange rate risk. A depreciating Rupiah increases COGS. However, export revenue (in USD) acts as a natural hedge, mitigating this exposure to a significant degree.
Industry Structure and Outlook
The Indonesian confectionery market is projected to grow at a Compound Annual Growth Rate (CAGR) of 3-5% through 2029. The market is bifurcated into Hard Candy and Soft Candy. Hard candy (mints, coffee drops) is mature and slower-growing, while soft candy (gummies, chews) is the growth engine, driven by texture innovation and youth demographics.
The Company occupies a “Sweet Spot.” It does not compete directly with Mayora’s ($MYOR) core biscuit business or Indofood’s noodle empire. Its dominance in gummies isolates it from the fierce price wars seen in the savory snack market. The high barrier to entry for quality gummy manufacturing (requires specific humidity control technology) prevents fragmentation by small home-industry players, preserving market share.
Peer Performance Comparison
Below is a comparative chart of key peers in the consumer sector to illustrate market trends.
Comparison chart of MYOR, GOOD, ICBP with timeframe 1 Year.
Financial Deep Dive
Income Statement Analysis
The financial performance leading up to the IPO has been characterized by strong revenue generation and exceptional profitability.
Revenue Performance: For the nine months ended September 30, 2024, the Company reported revenue of IDR 2.25 trillion. Annualizing this figure suggests a full-year 2024 top line of approximately IDR 3.0 – 3.1 trillion. Revenue grew from IDR 2.31 trillion in 2021 to IDR 3.13 trillion in 2023, representing a CAGR of ~11%. While 2024 shows a slight moderation, this is likely due to normalization after the post-pandemic consumption surge.
Profitability Profile: Gross Profit Margin (GPM) has been consistently maintained above 30% (32.46% TTM Sep 2025). This is superior to many FMCG peers, reflecting pricing power and efficient manufacturing. For 9M 2024, the Company recorded a net profit of IDR 484 billion, implying a Net Profit Margin (NPM) of roughly 21%. An NPM of 20%+ is exceptionally high for a manufacturing business (peers typically 8-12%), raising questions about sustainability. Is this margin driven by temporarily low sugar prices or sustainable operational efficiency? Investors should be wary of “IPO dressing,” where discretionary expenses (marketing, R&D) are temporarily cut to boost bottom-line figures before listing.
Balance Sheet and Solvency
The balance sheet prior to the IPO is remarkably clean, a rarity for companies seeking public funds. Total assets stood at IDR 2.99 trillion as of September 2024, dominated by non-current assets (factories and machinery). Total liabilities were approximately IDR 1.28 trillion, resulting in a Debt-to-Equity Ratio (DER) of roughly 0.4x – 0.5x. The company has very low interest-bearing debt relative to its equity, with an extremely comfortable interest coverage ratio (>20x), indicating zero solvency risk in the near term. Return on Equity (ROE) is robust, calculated at approximately 23-32%, showcasing highly efficient capital deployment.
Valuation & Pricing Analysis
The valuation of $YUPI is the most contentious aspect of this IPO. The offering price range of IDR 2,100 – IDR 2,500 places the company at a significant premium to the market.
| Scenario | Price (IDR) | Market Cap (IDR Tn) | PER (2024F) | PBV (Post-IPO) | Valuation Stance |
|---|---|---|---|---|---|
| Minimum | 2,100 | 17.94 | 27.8x | 6.4x | Demanding |
| Median | 2,300 | 19.65 | 30.5x | 7.0x | Aggressive |
| Maximum | 2,500 | 21.36 | 33.1x | 7.6x | Expensive |
Peer Benchmarking
The company is asking investors to pay a 50-90% premium over established blue-chip peers on a PER basis. On a PBV basis, the premium is even starker (>100%).
| Ticker | Company | PER (Est.) | PBV (Est.) | Notes |
|---|---|---|---|---|
| $YUPI | Yupi Indo Jelly Gum | 27.8x – 33.1x | 6.4x – 7.6x | Dominant but priced for perfection. |
| $MYOR | Mayora Indah | ~17x | ~2.8x | Larger, more diversified track record. |
| $GOOD | Garudafood | ~22x | ~3.6x | Comparable consumer play. |
| $ICBP | Indofood CBP | ~15x | ~2.0x | Market leader defensive stock. |
Risk Note: If margins compress to industry norms (10-12%) due to competition or input costs, the earnings power would halve, causing the PER to skyrocket effectively to 60x at current prices. There is zero margin of safety priced into this IPO. The valuation assumes perfection in execution and margin sustainability forever.
Lock-Up & Control Analysis
Regulatory Compliance (POJK No. 25/2017): According to OJK regulations, any party obtaining shares at a price below the IPO price within 6 months prior to the listing, or existing controllers, are subject to an 8-month lock-up period. PT Sweets Indonesia and Daniel Budiman are subject to this 8-month lock-up for the shares they retain. However, they are divesting 7% of the company’s total shares during the IPO. The IPO mechanism essentially allows them to bypass the lock-up for a significant portion of their holdings by selling them as part of the offering itself.
Control Analysis: The post-IPO acquisition by PT Confectionery Consumer Products Indonesia (CCPI) is the defining control event. CCPI will acquire 90% of the company. This consolidation of control into a new entity suggests a long-term holding strategy by the ultimate beneficial owners (likely the same family or group restructuring their assets). The public’s 10% float is the bare minimum required for listing, indicating that the controllers intend to keep the supply of shares tight, which could support the stock price artificially due to scarcity but also lead to illiquidity.
Underwriter Analysis
The Company has appointed a syndicate of underwriters to lead the offering.
PT Mandiri Sekuritas (CC): A top-tier state-owned underwriter usually associated with institutional stability.
PT CIMB Niaga Sekuritas (C3): Provides strong distribution capability in the region.
PT OCBC Sekuritas Indonesia (TP): Supporting the syndicate with additional retail and institutional reach.
Note: Specific quantitative track record metrics for these underwriters in the context of this specific deal size were unavailable at the time of research. Investors are advised that while these are established names, the specific “IPO popping” probability cannot be strictly quantified without historical JSON data.
Risks & Mitigation
Valuation Risk (High): The PER of 30x+ is the single biggest risk. Any earnings miss or margin compression will lead to a severe de-rating. Mitigation: None for the investor; strictly an avoidance strategy.
Raw Material Price Volatility: Sugar and gelatin prices directly impact COGS. Mitigation: The Company passes costs to consumers, but price sensitivity in the mass market limits this ability. The USD revenue from exports provides a partial hedge against gelatin import costs.
Regulatory Risk (Sugar Tax): The Indonesian government has discussed implementing excise taxes on sweetened beverages and potentially sugary foods to combat diabetes. Mitigation: Diversification into “Bolicious” (fruit juice added) and fortified gummies helps, but the core portfolio remains vulnerable.
Liquidity Risk: With only a 10% free float and a potential strategic buyback/acquisition narrative, trading volume may dry up post-IPO, making it difficult for institutional investors to exit large positions.
Conclusion & Recommendation
PT Yupi Indo Jelly Gum Tbk is a “Crown Jewel” asset being sold at a “King’s Ransom.” Fundamentally, it is one of the highest-quality consumer companies to list on the IDX in recent years, boasting monopolistic market share, debt-free operations, and margins that dwarf its competitors. However, the IPO structure is engineered to maximize the seller’s return, not the buyer’s upside. The valuation (27x-33x PER) prices in years of flawless growth, ignoring the reality of a mature 10% growth rate. The heavy divestment component confirms that this is a liquidity event for the founders rather than a growth capital raise.
Strategic View
Fundamental Investor View: AVOID / WATCHLIST. Great company, wrong price. There is no margin of safety. Investing at 30x earnings for a 10% grower is a recipe for capital stagnation. Investors should wait for a secondary market correction or a de-rating to the 18x-20x PER range (approx. IDR 1,400 – 1,600 levels) before accumulating.
IPO Hunter View: SUBSCRIBE (Speculative/Small Allocation). Despite the valuation, the “Yupi” brand power is immense. Retail demand is expected to be high due to brand familiarity. The scarce float (only 10%) combined with the “change of control” acquisition narrative post-IPO could create a floor on the stock price or drive short-term momentum.
Consolidated aluna Analytics Rating: Neutral (5.8/10)
The high business quality is offset significantly by the poor valuation and deal structure.
Disclaimer
aluna Analytics is an independent research collective that operates without affiliation to any financial institution, broker, or advisory firm. We do not hold licenses as a securities dealer, investment advisor, or portfolio manager.
All materials published by aluna Analytics are created solely for informational and educational purposes. They reflect independent analytical interpretation and should not be regarded as personalized investment advice, solicitation, or endorsement of any security or strategy.
Market data, opinions, and projections presented herein are subject to change and may not predict future results. Readers remain fully responsible for any financial decisions made based on the information provided. We strongly encourage conducting personal due diligence and consulting a licensed professional before making investment commitments.
aluna Analytics is not regulated by the Financial Services Authority of Indonesia (OJK) and does not offer investment management or brokerage services. All content is presented in good faith, aiming to foster research literacy and informed market perspectives.