




Author: aluna Analytics | Date: 3 December 2025 | Sector: Consumer Non-Cyclicals / Processed Foods | Recommendation: Subscribe (Trading Buy) / Speculative Buy (Long-Term Fundamental)
The listing of PT Abadi Lestari Indonesia Tbk (“Abadi Lestari,” the “Company,” or “RLCO”) on the Indonesia Stock Exchange (IDX) on December 8, 2025, represents a significant event in the evolution of Indonesia’s agri-commodity downstreaming narrative. Entering the market under the ticker $RLCO, the Company offered 625 million new common shares at a fixed price of IDR 168 per share, successfully raising IDR 105 billion in fresh capital.
This issuance initially valued the Company at a market capitalization of approximately IDR 525 billion. However, the immediate post-listing market reaction has been nothing short of euphoric. The stock surged to hit the Auto Rejection Atas (ARA) limit on its debut, climbing 34.52% to IDR 226, and continued a bullish trajectory to reach levels near IDR 550 by mid-December. This drastic re-rating places $RLCO in a fascinating position vis-à-vis its closest listed peer, PT Esta Indonesia Tbk ($NEST), creating a dual-narrative of a “catch-up trade” driven by scarcity and a “speculative bubble” driven by retail momentum.
This report serves as an exhaustive analysis of the offering, conducted through the lens of aluna Analytics’ proprietary framework. We move beyond the surface-level metrics to dissect the structural, financial, and regulatory underpinnings of this Bird’s Nest enterprise.
RLCO
PT Abadi Lestari Indonesia TbkThe timing of this IPO is critical. It occurs against a backdrop of Indonesia’s push to downstream its natural resources. RLCO is positioning itself not merely as a commodity exporter of edible bird’s nests (EBN) but as a consumer goods player through its association with the “Realfood” brand ecosystem. This shift from low-margin commodity trading to high-margin branded health products is the core of the bullish thesis.
Financially, RLCO presents a narrative of explosive growth: for the five-month period ended May 31, 2025, the Company reported a staggering 579% year-on-year increase in net profit, driven by a confluence of revenue growth and drastic cost efficiencies that demand skeptical scrutiny.
However, the investment thesis is fraught with latent risks. RLCO operates in a high-stakes environment heavily dependent on the Chinese market. The General Administration of Customs of China (GACC) has recently intensified scrutiny on nitrate and aluminum content in EBN imports, creating a binary risk profile for exporters. Furthermore, the allocation of IPO proceeds reveals a strategy of aggressively subsidizing the raw material procurement for its subsidiary, PT Realfood Winta Asia, suggesting a vertically integrated play that is both ambitious and capital-intensive.
Our final rating leverages a weighted analysis of the Company’s aggressive growth metrics, the speculative fervor surrounding the EBN sector, and the underwriter’s (Samuel Sekuritas) track record. We issue a Subscribe/Trading Buy rating, acknowledging the strong momentum and “scarcity premium” of pure-play EBN stocks. However, for long-term fundamental investors, the current trading valuation requires a Speculative Buy approach, contingent on the Company’s ability to navigate China’s volatile regulatory non-tariff barriers.
Disclaimer: This research report is produced by aluna Analytics for informational and educational purposes only. It does not constitute a recommendation to buy or sell any securities. Market data is analyzed as of 3 December 2025. Investors should conduct their own due diligence and consult with a certified financial advisor before making investment decisions.
IPO Structure and Deal Mechanics
The Offering in Detail
The structure of the RLCO IPO was engineered to inject liquidity directly into the operational engine of the business. Unlike mixed offerings seen in other recent IPOs where early investors utilized the public listing as a liquidity event (secondary shares), RLCO’s offering is composed 100% of new shares (primary issuance). This is a critical governance signal, indicating that the capital raised is intended entirely for business expansion and balance sheet fortification rather than cashing out existing stakeholders.
| Metric | Offering Detail | Implication |
|---|---|---|
| Ticker Code | RLCO | Listed on the Development Board (Papan Pengembangan), indicating a mid-sized growth company. |
| IPO Price | IDR 168 (Fixed) | Priced at the upper bound of the book-building range (IDR 150-168), reflecting maximum valuation confidence. |
| Shares Offered | 625,000,000 New Common Shares | Represents 20.00% of the enlarged paid-up capital. This float is sufficient to ensure liquidity but tight enough to create scarcity. |
| Total Funds Raised | IDR 105,000,000,000 | A “Small-Cap” IPO, making it highly susceptible to volatility and rapid price appreciation driven by retail flow. |
| Nominal Value | IDR 50 per share | Standard nominal value for mid-cap issuances on the IDX. |
| Market Cap (IPO) | IDR 525 Billion | Valued conservatively at launch compared to peers, catalyzing the post-IPO rally. |
| Underwriter | PT Samuel Sekuritas Indonesia | Sole underwriter with full commitment. Their involvement typically signals a high-momentum listing. |
| Oversubscription | ~94.8x – 143x | Reports vary between 94.8x and 143x oversubscription, confirming immense retail and institutional appetite. |
The Regulatory Pivot: Impact of SEOJK 25/2025
The RLCO IPO was conducted under the evolving regulatory landscape of the Financial Services Authority (OJK). While specifically highlighted in concurrent IPOs like SUPA, the principles of equitable allocation (e-IPO) heavily influenced the distribution of RLCO shares. The massive oversubscription (up to 143x) implies that the pooling allotment for retail investors was severely diluted, leading to a “lottery ticket” effect where successful allotment became a primary driver of secondary market demand. Investors who failed to secure shares during the allocation phase were forced to chase the stock on the open market, contributing to the immediate price surge.
Use of Proceeds: Fueling the Supply Chain
The prospectus outlines a highly concentrated use of proceeds, focusing entirely on working capital and supply chain security. This allocation strategy highlights the capital-intensive nature of the EBN trade, where cash is essentially tied up in inventory (raw nests) that requires time-consuming processing before export.
| Allocation | Percentage | Purpose | Analysis |
|---|---|---|---|
| Working Capital (Parent) | 56.33% | Purchase of raw materials (raw bird’s nests) for RLCO’s export operations. | Enables RLCO to secure premium raw nests during harvest seasons, locking in margins against volatile commodity prices. |
| Capital Injection (Subsidiary) | 43.67% | Equity injection into PT Realfood Winta Asia for purchasing raw materials. | This is the strategic pivot. Realfood Winta Asia is the entity behind the consumer brand. By subsidizing its procurement, RLCO effectively lowers the COGS for its high-margin downstream products. |
Aluna Analytics Insight: The allocation reveals a clear strategy: Inventory is King. In the EBN industry, the ability to procure high-quality raw nests determines the yield of the final processed product. “Dirty” nests require more labor to clean, reducing margins. By capitalizing the company with IDR 105 billion, RLCO can compete for the “cleanest” raw materials, thereby improving operational efficiency downstream.
Lock-Up Provisions: Controlling the Float
To prevent immediate selling pressure and stabilize the post-IPO price action, strict lock-up provisions have been implemented. These are governed by both OJK regulations and voluntary agreements by the controllers.
- Mandatory Lock-Up (POJK 25/2017): Shareholders who acquired equity at a price below the IPO price within 6 months prior to the registration statement are prohibited from selling for 8 months. This applies to the primary shareholders: PT Realco Omega Investama, Edwin Pranata, Budiono, and Edi Haryanto. This effectively freezes approximately 80% of the company’s pre-IPO capital.
- Voluntary Lock-Up: Beyond the regulatory requirement, the controlling shareholders have agreed to a voluntary lock-up period of 8 months for all shares. Furthermore, the Controller, Edwin Pranata, has committed to not transferring control for at least 12 months.
Implication: This creates a significant “liquidity vacuum” for the first two quarters of trading. With only 20% of shares (the public float) available for trading and exceptionally high demand (evidenced by oversubscription), the stock is prone to sharp upward volatility. This “cornering” effect is a structural feature of the deal that traders have exploited to drive the price to IDR 550.
Company Profile and The “Realfood” Ecosystem
Corporate History and Transformation
PT Abadi Lestari Indonesia Tbk traces its roots to the heart of Indonesia’s bird’s nest industry in Bojonegoro, East Java. Initially operating as a conventional exporter of raw, cleaned bird’s nests to wholesale markets in Hong Kong and China, the company recognized the inherent limitations of the commodity trade: price volatility, thin margins, and vulnerability to regulatory shocks.
The strategic inflection point occurred with the decision to develop downstream capabilities. The Company evolved from a raw material supplier into a manufacturer of “Superfood” products. This transformation was crystallized through its subsidiary, PT Realfood Winta Asia, which pioneered the “Realfood” brand—a line of semi-concentrated bird’s nest beverages marketed towards the modern, health-conscious urban demographic. This shift effectively moves RLCO from the agricultural sector (price taker) to the consumer goods sector (price maker).
Business Model: The “Seed-to-Sip” Integration
RLCO operates a vertically integrated model that controls critical stages of the value chain, creating a defensive moat against pure commodity traders.
- Upstream (Procurement): The company sources raw nests from a network of swiftlet houses (rumah walet) across Java and Kalimantan. The IPO proceeds are specifically designated to strengthen this procurement power, allowing RLCO to buy in bulk and secure better pricing.
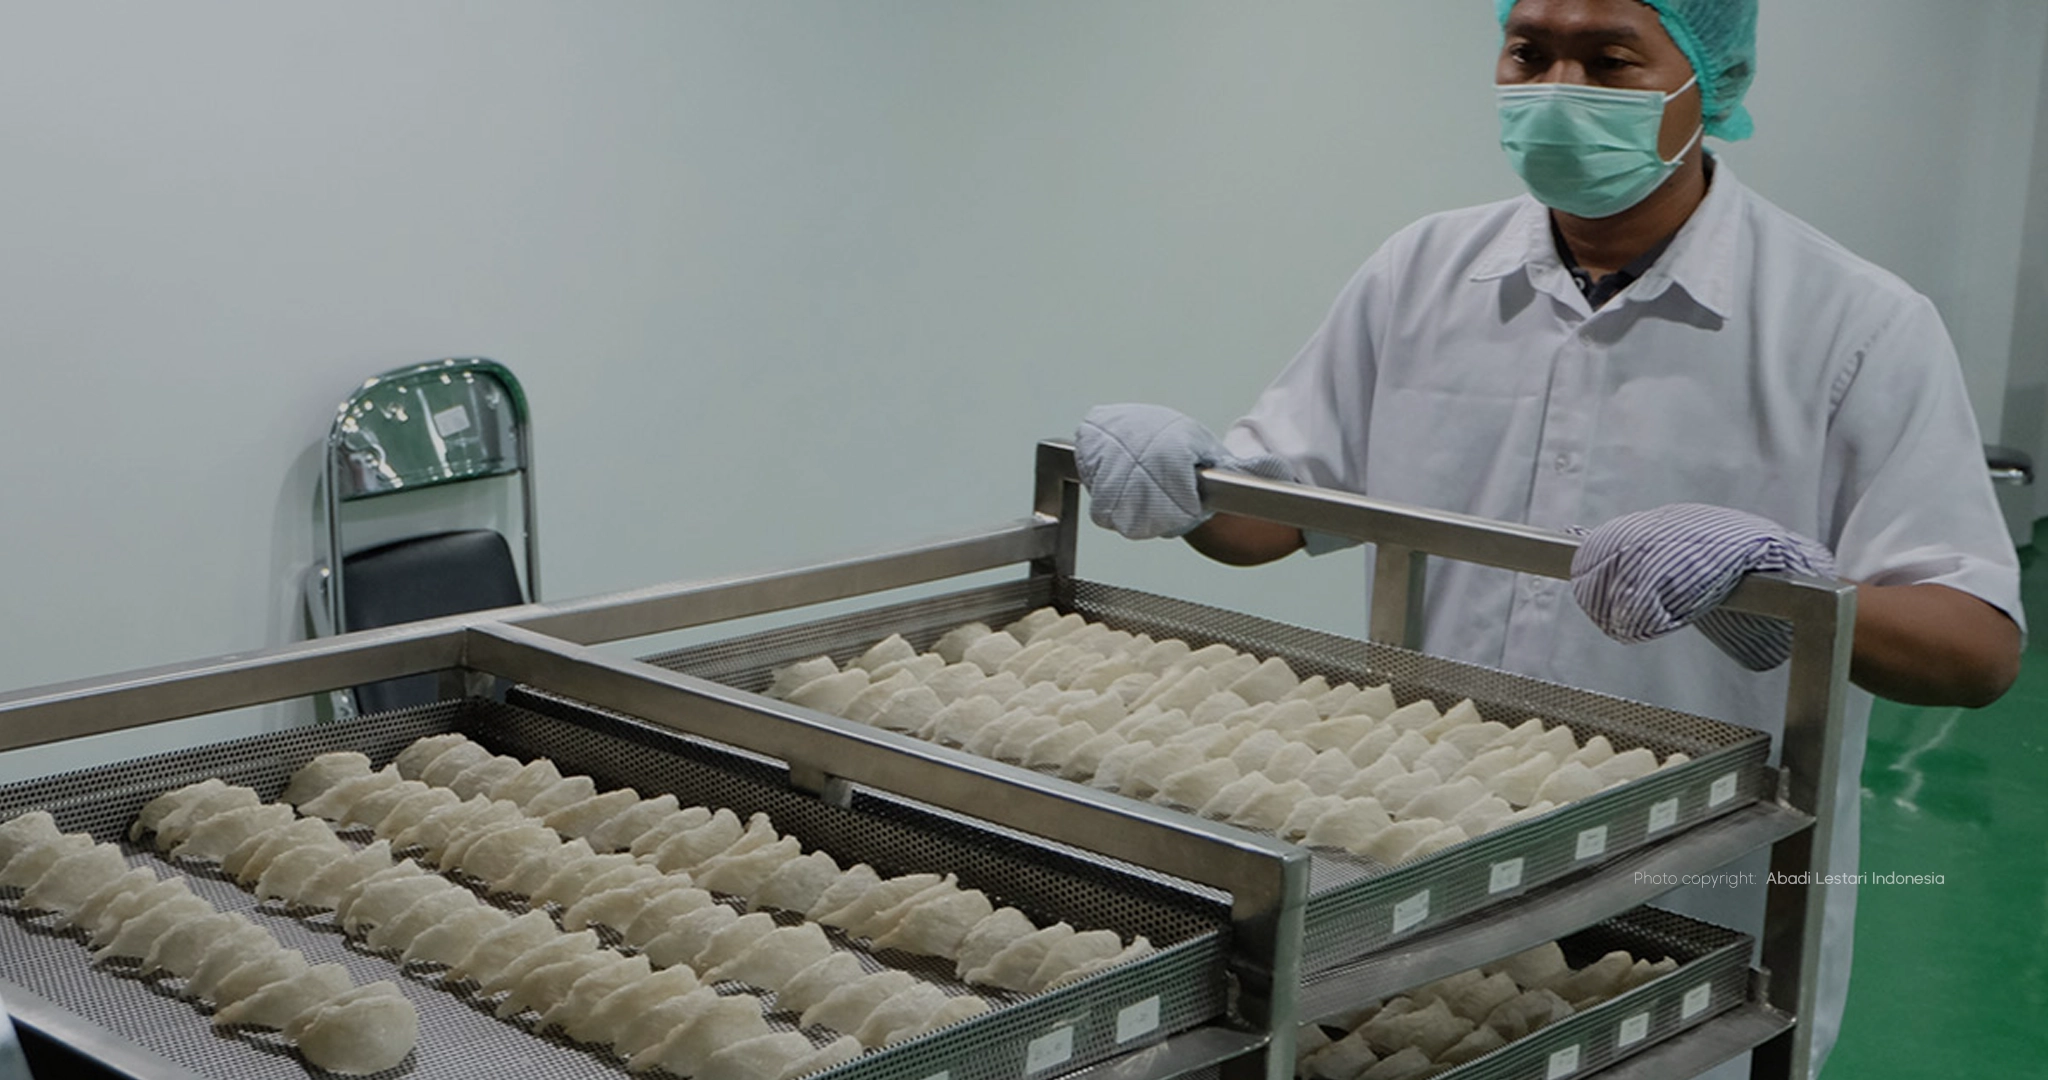
- Midstream (Processing): This is the core operational bottleneck. The nests must be cleaned, deburred (feathers removed), and molded. This stage is labor-intensive and requires strict adherence to hygiene standards, particularly thermal processing protocols (heating at >70°C) to meet the General Administration of Customs of China (GACC) requirements.
- Downstream (Brand & Export):
- Export: The parent company (RLCO) handles the export of processed nests (Yan Wo) primarily to China, Hong Kong, and the US.
- Consumer Goods: Through its subsidiary, RLCO produces branded products like “Realfood Jelly,” “Fit with Realfood,” and “Realfood Cleanse.”
Aluna Analytics Insight: The brilliance of this model lies in waste minimization and arbitrage. In the EBN trade, broken nests (hancuran) trade at a significant discount to whole cups (mangkok). However, nutritionally, they are identical. By utilizing broken nests—which have lower export value—as the raw material for Realfood beverages, RLCO arbitrages the spread between the low cost of raw materials and the premium price of branded functional health drinks.
Shareholder Structure and Beneficiaries
Post-IPO, the ownership structure remains heavily concentrated, ensuring centralized decision-making but raising valid concerns regarding minority shareholder influence.
| Shareholder | Ownership % | Role |
|---|---|---|
| PT Realco Omega Investama | 77.60% | The holding vehicle, ensuring stability and control. |
| Public | 20.00% | The free float available for trading. |
| Edwin Pranata | 2.32% | President Director and Controller. |
| Budiono | 0.04% | Individual Shareholder. |
| Edi Haryanto | 0.04% | Individual Shareholder. |
The presence of a dominant controller (Realco Omega) aligns with the typical structure of Indonesian family-owned conglomerates. Edwin Pranata’s direct stake, combined with his control over Realco Omega, confirms him as the ultimate beneficial owner (UBO). His 12-month lock-up commitment acts as a strong signal of insider conviction in the company’s medium-term growth trajectory.
Industry and Macroeconomic Analysis
The Edible Bird’s Nest (EBN) Market: “Caviar of the East”
The global EBN market is a unique, high-value niche dominated by a single supplier (Indonesia) and a single consumer (China). Indonesia produces approximately 75-80% of the world’s supply, while China consumes over 80-90% of global output. This monopsony dynamic dictates the economics of the trade.
Demand Drivers: In Traditional Chinese Medicine (TCM), bird’s nest is prized for its high glycoprotein content and Epidermal Growth Factor (EGF). It is believed to boost immunity, improve skin complexion, and aid respiratory recovery. The post-pandemic era has accelerated this demand as Chinese consumers prioritize lung health and immunity boosters.
Market Size & Growth: Indonesia’s exports to China reached USD 428 million in 2024. The total global market is projected to reach USD 1.6 billion by 2033, growing at a CAGR of 5.4%. This structural growth underpins RLCO’s revenue trajectory, provided it can maintain access to the Chinese market.
Regulatory Minefield: The GACC Factor
The single biggest risk factor for RLCO is the General Administration of Customs of China (GACC). China enforces draconian standards on EBN imports to protect its consumers and domestic industry. Understanding this regulatory landscape is crucial for investors.
The Aluminum & Nitrite Crisis (2025): Throughout late 2024 and 2025, GACC intensified inspections regarding aluminum content and nitrite levels in Indonesian bird’s nests. Several batches from Indonesian exporters were rejected for exceeding the 14mg/kg limit for nitrites or showing elevated aluminum traces.
Traceability Requirements: GACC mandates full traceability from the swiftlet house to the final packaging. Each export batch must be accompanied by a veterinary health certificate and originate from a registered processing facility.
Impact on RLCO: RLCO must maintain impeccable processing standards (specifically heating protocols) to retain its export license. The Indonesian Quarantine Agency (Barantin) has responded by enforcing stricter pre-export audits. Any failure in RLCO’s supply chain to meet these shifting GACC standards could lead to an immediate suspension of exports—a catastrophic revenue event. This binary risk (Open/Closed market access) justifies a risk premium in the stock’s valuation.
Competitive Landscape: RLCO vs. NEST
The listing of PT Esta Indonesia Tbk ($NEST) in August 2024 provides a perfect benchmark for RLCO. NEST is a direct competitor in the EBN export space but differs slightly in business focus.
Comparison chart of RLCO, NEST with timeframe 1 Month.
| Metric | RLCO (Abadi Lestari) | NEST (Esta Indonesia) |
|---|---|---|
| Market Cap | ~IDR 1.7 Trillion (at IDR 550) | ~IDR 1.6 Trillion |
| Revenue (FY24) | IDR 530 Billion | IDR 541 Billion |
| Net Profit (FY24) | IDR 9.6 Billion | IDR 27.1 Billion |
| Net Margin | ~1.8% | ~5.0% |
| PER (Trailing) | >100x (at IDR 550) | ~60-70x |
| Business Focus | Export + Branded Consumer (Realfood) | Pure Export / Upstream Focus |
Aluna Analytics Insight: While $NEST has historically higher margins due to its upstream focus (owning farms/houses), RLCO is aggressively pricing in the growth potential of its consumer brand. The market is willing to pay a premium for RLCO (despite lower current margins) because the “Realfood” brand offers scalability and defensive characteristics that raw commodity export (NEST) lacks. However, the valuation gap suggests RLCO is currently priced for perfection.
Financial Deep Dive: The “Hockey Stick” Growth
RLCO’s financial statements reveal a company in the midst of a violent upward inflection. Investors must discern whether this is a sustainable structural shift or “window dressing” designed to maximize IPO valuation. We analyze the audited figures for 2022-2024 and the unaudited interim results for May 2025.
Income Statement Forensics: The 2025 Explosion
The financial performance for the period ended May 31, 2025, is the centerpiece of the bull case.
| Metric | 31 Dec 2022 | 31 Dec 2023 | 31 Dec 2024 | 31 May 2024 (Unaudited) | 31 May 2025 (Unaudited) | Growth (May 25 vs 24) |
|---|---|---|---|---|---|---|
| Revenue | 379.45 B | 467.95 B | 530.38 B | 156.76 B | 231.31 B | +47.6% |
| Gross Profit | 58.48 B | 81.38 B | 106.97 B | 36.58 B | 52.78 B | +44.3% |
| Net Profit | 8.80 B | 7.59 B | 9.63 B | 1.82 B | 12.38 B | +579.4% |
Revenue Growth: Revenue for the first five months of 2025 hit IDR 231.3 billion, putting the company on a run-rate to exceed IDR 550 billion for the full year. This growth outpaces the industry average, suggesting RLCO is gaining market share or successfully pivoting to higher-value exports.
The Net Profit Surge (Red Flag or Efficiency?): The most startling metric is the 579% increase in net profit for the 5-month period in 2025 compared to the same period in 2024.
Driver Analysis: While revenue grew by ~48%, net profit grew by ~580%. This disproportionate growth indicates massive operating leverage. A deeper look suggests significant reductions in operating expenses relative to sales. Specifically, the prospectus hints at a 76% reduction in marketing expenses.
Forensic Note: A drastic cut in marketing spend immediately prior to an IPO is a classic technique to boost the bottom line and improve valuation multiples. While it demonstrates the potential profitability of the core business, it raises sustainability questions. Can RLCO maintain market share for “Realfood” with slashed marketing budgets? Likely not. Post-IPO, we expect marketing spend to normalize (increase), which may compress net margins back toward the 2-4% range in 2026.
Balance Sheet: Restructuring and Asset Growth
Asset Base: Total assets jumped to IDR 685.8 billion in May 2025 from IDR 636.9 billion in Dec 2024. The asset base is heavily weighted towards current assets (inventory and receivables), typical for a trading/processing firm.
Equity Explosion: Total Equity surged to IDR 176.5 billion in May 2025 from just IDR 65 billion in Dec 2024. This was not due to organic profit accumulation alone but driven by a capitalization of retained earnings and fresh capital injections by the existing shareholders prior to the IPO. The share capital (Modal Saham) increased from IDR 3 billion to IDR 125 billion via this restructuring.
Liabilities: Total liabilities stood at IDR 509.3 billion. While high, the Debt-to-Equity (DER) ratio dropped significantly from the astronomically high levels seen in 2023/2024 (where it was >8x) to a more manageable level (~2.8x) post-restructuring.
Insight: The pre-IPO balance sheet restructuring was crucial. By converting retained earnings into equity, the owners “cleaned up” the solvency ratios to make the IPO palatable to institutional investors. The IPO proceeds of IDR 105 billion will further de-risk the balance sheet, lowering the leverage ratio and providing breathing room for working capital needs.
Cash Flow Dynamics
The company’s operating cash flow has historically been volatile and often negative due to the high working capital requirements of the EBN trade (purchasing nests in cash from farmers while selling on credit to export partners). The decision to allocate 100% of IPO proceeds to working capital confirms that liquidity management is the company’s primary operational constraint. The IPO effectively solves this liquidity crunch for the next 12-18 months, allowing for smoother procurement cycles.
Underwriter Analysis: The Samuel Sekuritas Factor
The choice of underwriter plays a statistically significant role in the stock’s post-IPO performance on the IDX. RLCO appointed PT Samuel Sekuritas Indonesia (IF) as the sole underwriter.
The “Samuel” Track Record
Samuel Sekuritas has established a reputation for managing IPOs that deliver distinct price action behaviors, often characterized by high volatility and strong initial returns.
Sector Expertise: They have handled tickers like $GOLF, $GTBO, and notably $NSSS (Nusantara Sawit), giving them familiarity with commodity and consumer-linked issuers.
Performance Profile: Stocks underwritten by Samuel often experience high retail participation. They are known for pricing IPOs “responsibly”—leaving enough money on the table for the secondary market to generate a “pop,” which attracts day traders and momentum funds.
The “ARA” Signature: Many of Samuel’s recent mid-cap IPOs have successfully hit the Auto Rejection Atas (ARA) limit on Day 1. RLCO followed this script perfectly, rising 34.5% immediately upon listing.
Market Maker Behavior
The trading pattern of RLCO in its first week—hitting ARA, sustaining high volume, and climbing to IDR 550—suggests active market making and strong sponsorship. The order book consistently showed massive bid queues (millions of lots) with little supply, a hallmark of a tightly controlled float managed by a capable underwriter. This “scarcity” was engineered by the allocation strategy and the rigid lock-up of 80% of shares.
Aluna Analytics Score for Underwriter: 8.5/10. Samuel Sekuritas delivered a textbook “hot” IPO, generating massive buzz and immediate returns for subscribers, although the long-term price stability remains to be tested once the lock-up expires.
Valuation Analysis: From Reasonable to Rich
Valuing RLCO requires a comparative approach against its closest peer, NEST, and the broader consumer health sector. The rapid price appreciation post-IPO has fundamentally shifted the valuation landscape.
Valuation Metrics (At IPO vs. Current)
At IPO Price (IDR 168):
- Implied Market Cap: IDR 525 Billion.
- Annualized PER (2025 Est): ~17x – 20x (based on annualized 5M25 profit).
- PBV: ~1.7x.
- Verdict: At IPO, RLCO was priced at a significant discount to NEST (which traded at >60x PER). This arbitrage gap was the primary driver of the buying frenzy.
At Current Price (IDR 550 – Dec 12):
- Implied Market Cap: ~IDR 1.72 Trillion.
- Annualized PER: ~60x – 70x (assuming full year profit of ~IDR 25-30bn).
- PBV: ~5.0x – 6.0x.
- Verdict: The valuation gap has closed completely. RLCO is now trading at valuations comparable to, or even exceeding, NEST. It has transitioned from “undervalued” to “priced for perfection.”
The Three-Layer Fair Value Model
We construct a valuation range based on three market scenarios for the next 12 months:
| Layer | Scenario | Target PER | Fair Value | Implied Risk/Upside |
|---|---|---|---|---|
| Layer 1: Conservative (Bear Case) | China imposes stricter non-tariff barriers (aluminum/nitrite) leading to export delays. Marketing spend ramps up to defend brand share, compressing net margins back to 2023 levels (~1.6%). | 20x (Sector median) | IDR 180 – 200 | -60% (Downside) |
| Layer 2: Moderate (Base Case) | Exports remain stable. The “Realfood” brand continues to grow at 20-30%. Margins normalize but remain healthy due to economies of scale from the new working capital. | 35x (Premium for growth) | IDR 350 – 400 | Moderate Correction |
| Layer 3: Aggressive (Bull Case) | RLCO successfully penetrates new markets (US, Vietnam) as planned. The market treats it purely as a “Consumer Health Tech” stock (like SIDO or KINO) rather than an agri-exporter. “Realfood” becomes a dominant lifestyle brand. | 60x+ (Matching NEST) | IDR 600 – 700 | +10% to +25% Upside |
Valuation Rating: Overextended (Short Term) / Constructive (Long Term). The stock has priced in the Bull Case very quickly. Investors entering at IDR 550 are essentially betting on zero regulatory friction and continued triple-digit profit growth.
aluna Analytics Recommendation
The “aluna Scorecard”
We utilize a weighted scoring system to objectively assess the investment quality.
| Factor | Weight | Score (1-10) | Rationale |
|---|---|---|---|
| Business Model & Moat | 30% | 8/10 | Vertical integration (Realfood) creates a defensive moat superior to pure commodity exporters. |
| Financial Growth | 25% | 9/10 | 579% profit growth is stellar, though partially engineered. Revenue trajectory is solid. |
| Regulatory Risk | 20% | 4/10 | High dependency on China (GACC) is a major structural weakness. One rejected shipment can tank the stock. |
| Underwriter/Momentum | 15% | 9/10 | Samuel Sekuritas + Retail Hype + Small Float = Explosive Price Action. |
| Valuation (Current) | 10% | 3/10 | At IDR 550, valuation is stretched (PER >60x). No margin of safety. |
| Weighted Score | 100% | 6.9 / 10 | Speculative Growth Play |
Strategic Recommendation
For IPO Hunters (Traders): TAKE PROFIT / TRADING BUY ON DIPS
The Play: The stock has already delivered “bagger” returns (168 -> 550). The easy money has been made.
Strategy: If you hold shares from the IPO allocation, take profit on at least 50% of the position to lock in gains. For new entries, do not chase at >IDR 550. Wait for a correction to the IDR 400-450 level (technical support/Base Case valuation) before re-entering for a bounce. Watch volume closely; if bid volume dries up, the illiquidity can cause a rapid price flush.
For Fundamental Investors (Long-Term): WAIT AND SEE
The Play: The current price assumes flawless execution of the downstream strategy and zero regulatory hiccups. This is optimistic given the history of China’s trade barriers.
Strategy: Monitor the Q3 and Q4 2025 financial reports. Specifically, verify if the Net Profit margin sustains itself or if marketing costs balloon again. Watch for any news regarding GACC/Barantin audit results. If the stock corrects to IDR 300-350 (normalizing to a 30-35x PER), it becomes a highly attractive accumulation target for a 2-3 year hold, betting on the “Realfood” brand equity rather than just the commodity export.
Conclusion
PT Abadi Lestari Indonesia Tbk (RLCO) is a compelling case study of a company successfully transitioning up the value chain. By using IPO proceeds to secure raw materials for its high-margin “Realfood” brand, RLCO is shedding the low-valuation skin of a commodity trader to don the premium valuation of a consumer health company.
The market has rewarded this narrative generously, perhaps too generously, in the first week of trading. While the growth metrics (579% profit jump) are dazzling, they are partly the result of pre-IPO cost optimization. The real test lies in 2026: can RLCO sustain these margins while navigating the treacherous regulatory waters of China’s import protocols?
The “Realfood” story is real, but the price is rich. Trade the momentum, but respect the regulatory risk.
Disclaimer
aluna Analytics is an independent research collective that operates without affiliation to any financial institution, broker, or advisory firm. We do not hold licenses as a securities dealer, investment advisor, or portfolio manager.
All materials published by aluna Analytics are created solely for informational and educational purposes. They reflect independent analytical interpretation and should not be regarded as personalized investment advice, solicitation, or endorsement of any security or strategy.
Market data, opinions, and projections presented herein are subject to change and may not predict future results. Readers remain fully responsible for any financial decisions made based on the information provided. We strongly encourage conducting personal due diligence and consulting a licensed professional before making investment commitments.
aluna Analytics is not regulated by the Financial Services Authority of Indonesia (OJK) and does not offer investment management or brokerage services. All content is presented in good faith, aiming to foster research literacy and informed market perspectives.


