
Author: aluna Analytics | Date: 30 April 2026 | Category: Market Intelligence
PT Chandra Asri Pacific Tbk ($TPIA) has historically operated as the premier integrated petrochemical producer in Indonesia. However, an assessment of the interim consolidated financial statements for the three-month period ended March 31, 2026, reveals a fundamentally transformed enterprise. Through a series of aggressive, large-scale acquisitions executed in late 2025 and finalized in early 2026, the company has pivoted from a pure-play petrochemical operator into a diversified regional conglomerate spanning chemicals, petroleum refining, fuel retail, and infrastructure. This strategic metamorphosis is vividly reflected in the first-quarter financials, which display explosive top-line growth, record-breaking accounting profitability, and a drastically altered balance sheet highly levered by acquisition debt.
For the first quarter of 2026, the company reported a staggering revenue surge to US$ 2.403 billion, up from US$ 622 million in the same period in 2025, alongside a record net profit of US$ 205 million and an EBITDA of US$ 421 million. This headline profitability suggests a triumphant validation of the diversification strategy. However, a forensic examination of the underlying cash flows, working capital dynamics, and macroeconomic catalysts reveals a highly complex, conditional, and cyclical narrative. The record earnings are largely the product of an unprecedented geopolitical supply shock, specifically, the escalating conflict involving the United States, Israel, and Iran, which has severely restricted traffic through the Strait of Hormuz. This macro event has temporarily driven Asian refining margins to historic highs, masking deep structural weakness in the core petrochemical division and papering over severe cash flow absorption.
While reported earnings are robust, the quality of these earnings is compromised by a severe operating cash flow deficit of US$ 191.1 million, driven by a massive expansion in working capital requirements. Furthermore, the balance sheet has absorbed substantial leverage to fund the acquisitions of Shell’s Energy and Chemicals Park in Singapore, rebranded as Aster Chemicals and Energy, and ExxonMobil’s Esso retail network. With total debt approaching US$ 5.68 billion and annualized finance costs running near US$ 380 million, the enterprise is highly geared at the exact moment it is harvesting peak cyclical margins.

Rp 1,470
The investment perspective is therefore highly nuanced. The company does not currently exhibit the characteristics of a high-quality, sustainable compounder. Instead, it presents as a highly leveraged, aggressively expanding cyclical operator that has executed a masterclass in cycle timing. The durability of its current returns is highly vulnerable to a mean reversion in global refining margins once geopolitical tensions ease. Consequently, the company represents a conditional investment case that warrants caution, heavily dependent on management’s ability to utilize current windfall cash generations to rapidly deleverage the balance sheet before the refining cycle normalizes.
To understand the current financial condition, one must map its rapid operational evolution. Traditionally, the vast majority of revenues were generated through the production and sale of olefins, polyolefins, and downstream petrochemical products. The economics of this legacy business are notoriously cyclical, highly capital intensive, and entirely dependent on the spread between crude-derived feedstocks, such as naphtha, and finished polymer prices. Recognizing the structural vulnerabilities of remaining a pure-play petrochemical manufacturer, particularly amid massive capacity additions in China that have chronically depressed regional margins, a programmatic merger and acquisition strategy was embarked upon. This strategy culminated in the establishment of three distinct operational pillars: Chemicals, Energy, and Infrastructure.
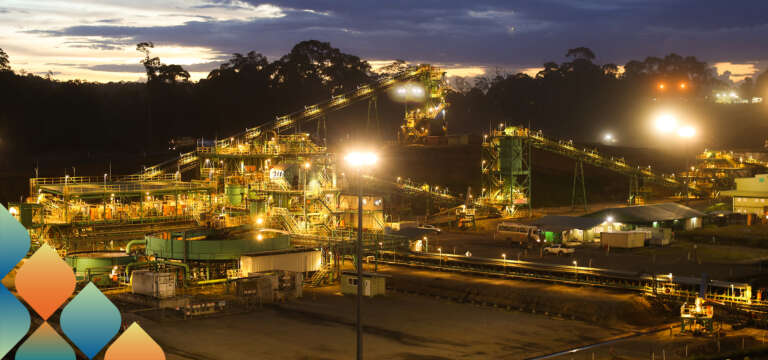
The Energy pillar was virtually manufactured overnight through two colossal transactions. First, a joint venture with Glencore, named CAPGC Pte. Ltd., was formed and is 80% owned by the parent company, to acquire Shell Singapore Pte. Ltd.’s Energy and Chemicals Park. This facility was subsequently renamed Aster Chemicals and Energy. Second, ExxonMobil’s Esso-branded retail service station network in Singapore was acquired via the subsidiary AMS1. These acquisitions integrated the operations vertically, allowing the capture of refining margins, securing internal feedstock sourcing for the chemical plants, and achieving end-market distribution through retail fuel channels.
The Infrastructure pillar is anchored by PT Chandra Daya Investasi Tbk ($CDIA), which houses the group’s logistics, power generation, water treatment, and port facilities. This entity acts as an internal utility and logistics provider, capturing stable, long-term yields that are theoretically insulated from the wild commodity swings of the chemical and energy markets. The financial statements for the period ended March 31, 2026, represent the first fully consolidated quarter reflecting this new tri-pillar structure, making it a critical baseline for analyzing future economic trajectories.
The sheer scale of the transformation is evidenced by the massive proliferation of subsidiaries, special purpose vehicles, and capital injections detailed in the financial disclosures. During late 2025 and early 2026, an aggressive corporate restructuring program was engaged to silo these new assets, optimize the tax structure, and facilitate external financing.
Within the Energy and International trading pillar, the “Aster” series of entities domiciled primarily in Singapore was established. For example, CAPGC Pte. Ltd. increased its paid-up capital to a staggering US$ 733.4 million in March 2025 to fund the Shell acquisition alongside Glencore. Following this, Aster Mobility Solutions Pte. Ltd. (AMS) and its subsidiary AMS1 were capitalized with US$ 254 million each in January 2026 to facilitate the ExxonMobil Esso retail acquisition. Further downstream, Aster Polymer Solutions Pte. Ltd. (APS) received a US$ 379.7 million capital injection in December 2025 following the acquisition of Chevron Philips Singapore Chemical Pte. Ltd. This rapid deployment of billions of dollars across Singaporean holding companies highlights a massive shift of the operational center of gravity away from the traditional Indonesian manufacturing base and toward international energy trading and retail.
Simultaneously, the Infrastructure pillar underwent significant corporate engineering. The infrastructure subsidiary became a focal point for capital raising. In late 2023 and early 2025, it underwent multiple capital increases, bringing in external investment from Phoenix Power B.V., culminating in an Initial Public Offering in July 2025 that raised US$ 77 million in fresh equity. This entity acts as the holding company for critical infrastructure assets like PT Krakatau Chandra Energi, which operates power plants, and PT Chandra Pelabuhan Nusantara, which manages port facilities.
The Chemicals pillar, despite its structural headwinds, continued to absorb capital for long-term expansion. PT Chandra Asri Perkasa, the entity tasked with building the second massive petrochemical complex, saw its authorized capital increased repeatedly, reaching US$ 944.8 million by December 2025. Furthermore, PT Chandra Asri Alkali was established to venture into the chlor-alkali market, injecting hundreds of millions of dollars over consecutive quarters. This relentless expansion across all three pillars simultaneously demonstrates immense ambition, but it also raises critical questions about operational bandwidth, integration risk, and the sheer volume of capital required to sustain these parallel mega-projects.
Line chart of Brent Crude Oil Futures (OIL-BRENT) with timeframe 1 Year.
Analyzing the first-quarter financial performance in isolation from the prevailing macroeconomic environment would yield a deeply flawed assessment. The financial figures are inextricably linked to a severe geopolitical crisis unfolding in the Middle East. In early 2026, military escalation led to the effective closure of the Strait of Hormuz, a maritime chokepoint responsible for approximately 20% of global seaborne crude oil and liquefied natural gas exports. The disruption removed over 13 million barrels per day of oil from international trade routes, causing a historic supply shock.
This geopolitical dislocation created a bifurcated economic reality for the two primary commodity divisions. For the newly acquired refining division, the crisis was a massive financial windfall. As global refined product inventories plummeted and alternative shipping routes failed to compensate for the lost volume, crack spreads—which represent the margin between crude oil and refined petroleum products—exploded. Middle distillate prices in Singapore surged to all-time highs above US$ 290 per barrel. Refining margins in Asia, which normally hover in the single digits, spiked dramatically from approximately US$ 5 to over US$ 25 per barrel. The Singapore facility captured these hyper-inflated margins, driving the group’s extraordinary US$ 421 million quarterly EBITDA.
Conversely, the legacy petrochemical division faced an existential crisis. The same geopolitical shock that inflated refined product prices also caused naphtha and ethylene feedstock costs to essentially double in Asia within a matter of weeks. Simultaneously, end-market demand for chemicals remained muted due to China’s continued macroeconomic sluggishness and persistent regional oversupply from newly commissioned Chinese mega-crackers. As a result, the petrochemical business was caught in a devastating margin squeeze.
The integration of the refining and chemical businesses essentially saved the enterprise from a disastrous quarter. The integration gains touted by management represent the internal transfer of economics, where the refining unit absorbed the pain of the chemical unit by capturing the value upstream. Therefore, the spectacular Q1 2026 profitability is not evidence of a permanently higher structural margin profile, but rather a temporary cyclical peak in the refining segment induced by a military blockade. Investors must critically evaluate whether these earnings are durable, as any resolution to the Hormuz blockade will inevitably compress refining margins back to historical norms.
The Interim Consolidated Statement of Profit or Loss for the three months ended March 31, 2026, quantifies the magnitude of this transformation. The top-line and core operating metrics reveal a dramatic shift in scale.
| Income Statement Metric | Q1 2026 (US$ Thousands) | Q1 2025 (US$ Thousands) | Change (%) |
|---|---|---|---|
| Revenues | 2,403,741 | 622,094 | + 286.4% |
| Raw Materials and Production Expenses | (1,872,260) | (592,775) | + 215.8% |
| Gross Profit (Implied) | 531,481 | 29,319 | + 1712.7% |
| Depreciation Expenses | (81,693) | (24,082) | + 239.2% |
| Selling Expenses | (19,738) | (10,100) | + 95.4% |
| General and Administrative Expenses | (43,719) | (18,310) | + 138.7% |
| Profit (Loss) Before Tax | 230,509 | (31,864) | N/A |
| Profit (Loss) for the Period | 205,085 | (23,583) | N/A |
Total revenues skyrocketed to US$ 2.403 billion, representing a nearly fourfold increase from the US$ 622 million reported in Q1 2025. This parabolic growth is purely structural, stemming directly from the consolidation of the refining complex and the retail network, which process and sell vastly higher volumes of high-value petroleum products compared to the legacy chemical business.
The cost of raw materials used and manufacturing expenses increased commensurately to US$ 1.872 billion, up from US$ 592.7 million. This results in an implied gross profit of approximately US$ 531.4 million. The expansion in gross margin, from roughly 4.7% in Q1 2025 to 22.1% in Q1 2026, is the direct accounting manifestation of the Singapore refining crack spread blowout discussed previously. The energy segment contributed the overwhelming majority of this gross profitability, heavily subsidizing the compressed chemical spreads.
However, moving down the income statement reveals significant friction costs associated with the new corporate structure and the volatile macro environment. Depreciation expenses climbed sharply to US$ 81.6 million from US$ 24.0 million. This increase is the natural consequence of capitalizing the massive fixed asset bases of the Singapore refinery and the extensive retail fuel network. Similarly, selling expenses nearly doubled to US$ 19.7 million, and general and administrative expenses expanded from US$ 18.3 million to US$ 43.7 million, reflecting the heavier operational footprint and the headcount absorption from the legacy asset owners.
Below the operating line, the financial statements expose acute vulnerabilities to market volatility. A substantial US$ 52.0 million loss on derivative financial instruments was recorded, a sharp deterioration from the US$ 3.1 million loss in the prior year. The accounting policies note the utilization of cross-currency swaps and interest rate swaps to manage exposures. Given that significant Rupiah-denominated debt is held alongside floating-rate US Dollar loans tied to SOFR and JIBOR, the global financial instability triggered by the Middle East crisis likely caused severe currency fluctuations and interest rate volatility, triggering mark-to-market losses on these hedging instruments.
Additionally, a net “other loss” of US$ 47.4 million was reported, completely reversing a US$ 15.2 million gain from the prior year. While the exact composition of these other losses is subject to internal allocation, such large non-operating deficits during periods of aggressive acquisition and integration typically relate to one-off restructuring costs, acquisition advisory fees, impairment charges, or adverse foreign exchange translations on unhedged operational liabilities.
Finance costs present the most structural headwind on the income statement. Interest expenses surged to US$ 94.8 million for the quarter, up from US$ 44.3 million in Q1 2025. This represents an annualized interest burden of nearly US$ 380 million. The cost of debt has escalated dramatically to finance the multibillion-dollar acquisition spree, highlighting a highly leveraged capital structure that demands sustained high EBITDA generation to service. Despite these heavy below-the-line deductions, the sheer magnitude of the gross profit windfall allowed the reporting of a pre-tax profit of US$ 230.5 million and a final net profit for the period of US$ 205.0 million.
A critical assessment of business quality requires reconciling reported accounting earnings with real cash generation. In the first quarter of 2026, there is a severe disconnect between the two. Despite reporting the highest net profit in its history, US$ 191.1 million in operating cash flow was burned through.
| Cash Flow Summary | Q1 2026 (US$ Thousands) | Q1 2025 (US$ Thousands) |
|---|---|---|
| Cash receipts from customers | 2,016,229 | 595,590 |
| Cash paid to suppliers, Directors, employees | (2,216,903) | (919,816) |
| Cash used in operations | (200,674) | (324,226) |
| Net Cash Used in Operating Activities | (191,130) | (318,760) |
| Net Cash Generated from Investing Activities | 68,833 | (670) |
| Net Cash Provided by Financing Activities | 209,415 | 688,426 |
| Net Increase in Cash and Cash Equivalents | 87,118 | 368,996 |
The Consolidated Statement of Cash Flows reveals that while US$ 2.016 billion in cash was collected from customers, US$ 2.216 billion was paid out to suppliers, directors, and employees. To understand this operational cash deficit, one must examine the working capital dynamics embedded in the Consolidated Statement of Financial Position.
| Key Working Capital Accounts | March 31, 2026 (US$ Thousands) | December 31, 2025 (US$ Thousands) | Variance (US$ Thousands) |
|---|---|---|---|
| Trade Accounts Receivable (Third Parties) | 1,036,610 | 614,705 | + 421,905 |
| Inventories (Net) | 1,189,052 | 1,254,362 | – 65,310 |
| Trade Accounts Payable (Third Parties) | 653,649 | 908,975 | – 255,326 |
| Accrued Expenses | 71,435 | 150,782 | – 79,347 |
The primary culprit for the cash bleed is a massive absorption of liquidity into trade accounts receivable. Receivables from third parties spiked from US$ 614.7 million at the end of 2025 to US$ 1.036 billion by March 31, 2026, representing an expansion of roughly US$ 421.9 million in just ninety days. This immense build-up is symptomatic of the transition into the energy trading and retail fuel markets, compounded by the macroeconomic shock. As crude and refined product prices soared during the quarter, the nominal value of every invoice issued increased proportionately. Furthermore, more lenient credit terms may have been extended to secure market share for the new trading desk, or downstream customers, including airlines, logistics firms, and manufacturers, may be delaying payments as they struggle with the sudden spike in fuel costs.
Compounding the cash outflow, trade accounts payable to third parties contracted sharply, falling from US$ 908.9 million to US$ 653.6 million, a reduction of US$ 255.3 million. In a normal operating environment, growing revenues are typically matched by growing payables as suppliers extend credit. The fact that payables shrank while revenues quadrupled is a severe red flag. It suggests that in the chaotic, supply-constrained environment following the Strait of Hormuz closure, crude and naphtha suppliers had to be paid much faster, or potentially in advance, to secure physical cargoes and maintain refinery utilization rates.
Simultaneously, accrued expenses dropped from US$ 150.7 million to US$ 71.4 million, representing another US$ 79.3 million cash outflow as prior-period obligations were settled. When combined, the expansion of receivables and the contraction of payables resulted in a working capital penalty exceeding US$ 677 million. This dynamic heavily degrades the quality of the reported US$ 205 million net profit. Massive accounting margins are being generated, but the cash required to fund the working capital of an integrated refinery operating at peak commodity prices is draining organic liquidity. If oil prices remain elevated or continue to rise, this working capital drag will persist, forcing continuous reliance on external financing to fund day-to-day operations.
The aggressive expansion into the energy sector has fundamentally rewired the balance sheet, elevating the financial risk profile through the capitalization of significant physical and intangible assets. The forensic footprint of the acquisitions is clearly visible in the asset classifications and their associated accounting treatments under PSAK 103 (Business Combinations).
At the close of 2025, an “Advance for investment” of US$ 954.6 million was carried. This line item represented the capital escrowed primarily for the retail network transaction via the AMS1 subsidiary. By March 31, 2026, this advance balance was zeroed out, signaling the formal closure and consolidation of the transaction. The allocation of this purchase price is evident across multiple asset categories. Property, Plant, and Equipment increased by US$ 443.4 million, reaching US$ 5.09 billion, while Right-of-use assets expanded by US$ 193.5 million to US$ 561.2 million, reflecting the capitalization of long-term land leases associated with the newly acquired network of nearly 60 service stations across Singapore.
Most critically, the Goodwill balance erupted from a mere US$ 2.8 million to US$ 287.6 million. This near-US$ 285 million injection of provisional goodwill indicates that a substantial premium was paid over the fair market value of the identifiable net assets for the retail network. Under PSAK 103, goodwill is measured as the excess of the consideration transferred over the net acquisition-date amounts of the identifiable assets acquired and liabilities assumed. While goodwill reflects the strategic value of the brand and the integrated network, it is an intangible asset that provides no downside protection to creditors. It is not amortized but must be tested for impairment annually or whenever indicators suggest a decline in value. If the retail energy market in Singapore deteriorates due to the accelerated adoption of electric vehicles or sustained high fuel costs causing demand destruction, this goodwill balance represents a significant latent write-down risk.
In the case of the Shell Energy and Chemicals Park acquisition, the transaction yielded a different accounting outcome. A bargain purchase gain was recognized, indicating that the fair value of the net assets acquired exceeded the purchase consideration. This was attributed to a difference in view regarding the strategic direction of the business between the seller and the acquirer. Bargain purchase gains immediately flow through the income statement, boosting reported profitability at the time of the transaction. However, acquiring distressed or non-core assets at a discount often implies that the assets require significant future capital expenditures or operational turnarounds to achieve sustainable profitability.
| Debt Classification | March 31, 2026 (US$ Thousands) | December 31, 2025 (US$ Thousands) |
|---|---|---|
| Short-term bank loans | 185,663 | 344,000 |
| Current maturities of Bank loans | 169,073 | 136,069 |
| Current maturities of Bonds payable | 154,108 | 72,481 |
| Current Lease liabilities | 60,549 | 41,345 |
| Long-term Bank loans | 4,145,424 | 3,971,081 |
| Long-term Bonds payable | 604,331 | 474,360 |
| Long-term Lease liabilities | 364,615 | 374,894 |
| Total Interest-Bearing Liabilities | 5,683,763 | 5,414,230 |
To finance this asset growth and bridge the massive working capital deficit, debt markets have been heavily leaned upon, erecting a highly complex and formidable capital structure. The balance sheet reflects a deep reliance on both domestic syndicated bank loans and international bond issuances.
Line chart of Chandra Asri Pacific Tbk (TPIA) with timeframe 1 Year.
The current portion of debt includes US$ 185.6 million in short-term bank loans, US$ 169.0 million in current maturities of long-term bank loans, and US$ 154.1 million in current bonds payable, alongside US$ 60.5 million in current lease liabilities. However, the non-current debt is where the true leverage lies. Long-term bank loans stand at US$ 4.145 billion, while long-term bonds payable amount to US$ 604.3 million. This brings the total debt burden to approximately US$ 5.68 billion.
A significant portion of this recent debt accumulation stems from bespoke financing arrangements. To facilitate the retail acquisition, a US$ 750 million unitranche loan from KKR’s Global Atlantic was secured. While this private credit facility offered execution speed and the flexibility to close a billion-dollar transaction, unitranche debt typically carries a higher cost of capital than traditional syndicated bank loans. This cost is already flowing through the income statement via the US$ 94.8 million quarterly finance charge.
The debt profile is highly fragmented across numerous lenders and tranches. Disclosures reveal a web of facilities, including a US$ 280 million term loan from Bank Mandiri (priced at SOFR + margin), a US$ 250 million term loan from Bank Negara Indonesia, a US$ 150 million facility from Bank OCBC NISP, and massive syndications reaching US$ 1 billion involving Standard Chartered, First Abu Dhabi Bank, and Mizuho. Furthermore, the domestic bond market has been aggressively tapped, issuing multiple tranches under Shelf Registration Bonds I through V, raising trillions of Rupiah to fund capital expenditures and refinance older, more expensive debt.
This fragmented debt structure comes with stringent financial covenants. The enterprise and its subsidiaries are routinely bound by requirements to maintain a “Total Consolidated Interest-Bearing Debt to Equity” ratio, often capped at 1.5x or 2.5x depending on the specific facility, or a modified “Total Consolidated Interest-Bearing Debt minus Non-Recourse Based Debts to Equity” ratio. The non-recourse carve-out is critical, as it allows aggressive leverage within subsidiaries without tripping the parent company’s covenants.
Despite the heavy debt load, a robust cash position of US$ 2.826 billion is maintained, up slightly from US$ 2.739 billion at the end of 2025. This deep liquidity buffer is essential for operational survival. The Cash Flow Statement reveals that US$ 227.3 million in new long-term bank loans and US$ 221.6 million from bond issuances were raised during the quarter, effectively borrowing to bolster cash reserves and fund the US$ 191.1 million operating cash deficit and US$ 134.7 million in capital expenditures. The capital structure is highly leveraged. With total equity attributable to owners of the parent at US$ 3.86 billion, the gross debt-to-equity ratio is uncomfortably high for a commodity cyclical. Survival relies entirely on the debt markets remaining open and accommodating to roll over short-term maturities and fund working capital needs.
The massive debt tower is heavily exposed to floating interest rates and foreign currency risks, necessitating a complex hedging strategy. Cross-currency swaps and interest rate swaps are entered into to manage these exposures, specifically utilizing these derivatives to fix the interest rate and convert the currency of Rupiah-denominated bonds into United States Dollars.
Under PSAK 118 and the financial instrument guidelines (PSAK 109 and PSAK 239), these derivatives are measured at fair value through profit or loss (FVTPL) unless they are part of a strictly designated cash flow hedge relationship. The US$ 52.0 million loss on derivative financial instruments recorded in the first quarter suggests that severe mark-to-market losses on these hedges were experienced. This is consistent with the macroeconomic environment; as the Middle East conflict caused global inflation fears to resurface, interest rates spiked and emerging market currencies, including the Rupiah, likely experienced severe volatility against the US Dollar.
Furthermore, the accounting policies regarding Expected Credit Losses (ECL) on the expanding receivables balance pose a latent risk. Lifetime ECL for trade accounts receivable is recognized using a provision matrix based on historical credit loss experience, adjusted for forward-looking economic conditions. Given the sudden spike in fuel prices and the resulting strain on the aviation and logistics sectors in Singapore and Southeast Asia, the probability of default among downstream customers has materially increased. If the macroeconomic shock induces a regional recession, significant impairment charges against the US$ 1.036 billion in third-party receivables may need to be booked, further deteriorating the asset base.
Assessing the underlying business quality requires separating the structural improvements achieved through M&A from the cyclical noise of the current energy market. The transformation from a standalone petrochemical producer into an integrated energy, chemicals, and infrastructure conglomerate undeniably improves the theoretical resilience. By owning the refinery, feedstock pricing and availability are controlled, theoretically shielding the chemical crackers from upstream supply shocks. By owning the retail network, guaranteed off-take volumes for refined motor fuels are secured, capturing the retail margin and reducing reliance on wholesale spot markets.
However, integration does not equate to immunity from commodity cycles. The business remains fundamentally a price-taker in global markets. It does not possess the pricing power or brand loyalty characteristic of a high-quality compounder. The retail fuel market in Singapore is highly competitive, dominated by entrenched players like Shell, Caltex, and SPC, and is subject to intense regulatory scrutiny and inflationary pressures. The infrastructure segment offers the only true element of high-quality, sticky revenue through long-term utility and logistics contracts, but it is currently dwarfed by the sheer scale of the energy and chemical trading operations.
The scalability of the business is also heavily constrained by physical infrastructure limits. Refineries and chemical plants have fixed nameplate capacities. Growth beyond operational optimization and debottlenecking requires massive, multi-year capital expenditures. Scale has essentially been bought through debt-funded acquisitions rather than built organically. This step-change in size brings significant integration and execution risks. Successfully merging the corporate cultures, IT systems, and logistics networks of former foreign assets with a domestic Indonesian firm is a monumental operational challenge. The spike in general and administrative expenses and selling expenses in Q1 2026 suggests that these integration friction costs are already materially impacting the bottom line.
Dependency risks remain critically elevated. There is deep dependence on the Middle East for crude oil sourcing. With over 60% of Southeast Asia’s oil imports originating from the Middle East, the closure of the Strait of Hormuz represents a localized existential threat. While the refinery allows the capture of the artificially inflated crack spread, it still requires physical crude deliveries to operate. If the blockade extends into a prolonged, multi-year conflict, even a highly profitable refinery will eventually face forced run-cuts due to a lack of physical feedstock. Furthermore, the core petrochemical division continues to face structural headwinds. China’s relentless expansion of petrochemical capacity has created a chronic oversupply in the Asian market, depressing olefin and polyolefin margins for the foreseeable future. The cyclical refining windfall is essentially being used to cross-subsidize a structurally impaired chemical business.
From a valuation perspective, a highly complex “value trap” dilemma is presented. If one were to simply annualize the Q1 2026 EBITDA of US$ 421 million, an impressive US$ 1.68 billion in annual EBITDA would be projected. Against a market capitalization and enterprise value typical of regional peers, this might optically imply a highly attractive, discounted trading multiple.
However, institutional valuation frameworks dictate that peak earnings in a cyclical industry must be assigned a heavily discounted multiple. The US$ 421 million EBITDA is contaminated by geopolitical risk premiums and artificial supply constraints. Normalizing these earnings requires forecasting a return to mid-cycle refining margins, which would drastically reduce forward profitability once the Middle East conflict resolves and the Strait of Hormuz reopens.
Furthermore, the enterprise value must heavily weight the US$ 5.68 billion in gross debt. The towering debt load subordinates equity holders and absorbs a massive portion of operating income through interest payments, with US$ 94.8 million expensed this quarter alone. When valuing the business, the negative free cash flow profile, driven by the US$ 191.1 million operating cash bleed, must take precedence over the accounting net profit. A business that requires constant external funding to maintain its working capital during an upcycle is structurally impaired and vulnerable to liquidity shocks.
The market should, in theory, reward the entity with a slight premium for its successful diversification and the creation of the infrastructure pillar, which serves to smooth out some earnings volatility. However, this premium is entirely offset by the aggressive financial engineering, the high cost of private credit facilities, and the execution risk inherent in absorbing massive foreign assets. Given the structural oversupply in core petrochemical markets and the transient nature of the current refining windfall, the business would generally justify a discounted valuation in a public market context. The equity essentially trades as a highly levered call option on the duration of the Middle East conflict and the persistence of elevated Asian crack spreads.
The financial statements for the period ended March 31, 2026, capture a company at the apex of a flawless, yet highly cyclical, strategic maneuver. By acquiring refining and retail assets in Singapore just before a historic geopolitical supply shock, the enterprise effectively insulated itself from the brutal downturn ravaging the Asian petrochemical industry. The resulting record net profit of US$ 205 million and US$ 421 million in EBITDA are testaments to the immediate mathematical benefits of vertical integration in a volatile commodity market.
However, a rigorous financial analysis reveals severe underlying frailties. The profitability is entirely unsupported by cash generation, as evidenced by the US$ 191.1 million operating cash deficit. The working capital required to sustain the new energy trading and retail divisions at elevated price levels is actively draining organic liquidity. To bridge this gap and fund the acquisitions, a towering US$ 5.68 billion debt structure has been erected that incurs punishing interest expenses, eroding the margin of safety for equity holders.
Therefore, it does not represent a high-conviction, buy-and-hold opportunity. It lacks the durable competitive advantages, pricing power, and free cash flow generation required of a high-quality compounder. Instead, it is a highly geared, aggressively managed cyclical play.
The investment case is strictly conditional. It depends entirely on capital discipline over the next four to six quarters. If the transient, geopolitically inflated margins from the refining and retail segments can be utilized to aggressively pay down high-cost debt and stabilize working capital, the equity will de-risk and re-rate favorably. Conversely, if expansion continues to be prioritized, or if the refining cycle normalizes before significant deleveraging occurs, the debt burden will overwhelm cash flows, exposing the equity to severe downside risk. For institutional allocators, the situation warrants extreme caution. While the headline numbers dazzle, the underlying cash flows and leveraged balance sheet demand a defensive posture. Exposure should only be considered by event-driven or distressed-debt specialists capable of dynamically hedging the commodity and interest rate risks embedded within this highly volatile, newly formed conglomerate.
Disclaimer
aluna Analytics is an independent research collective that operates without affiliation to any financial institution, broker, or advisory firm. We do not hold licenses as a securities dealer, investment advisor, or portfolio manager.
All materials published by aluna Analytics are created solely for informational and educational purposes. They reflect independent analytical interpretation and should not be regarded as personalized investment advice, solicitation, or endorsement of any security or strategy.
Market data, opinions, and projections presented herein are subject to change and may not predict future results. Readers remain fully responsible for any financial decisions made based on the information provided. We strongly encourage conducting personal due diligence and consulting a licensed professional before making investment commitments.
aluna Analytics is not regulated by the Financial Services Authority of Indonesia (OJK) and does not offer investment management or brokerage services. All content is presented in good faith, aiming to foster research literacy and informed market perspectives.